Percentage Difference Calculator
Compare two values with symmetric percentage difference, percent error, absolute difference, ratio, and directional percent change in one clear breakdown.
All result cards calculate every metric; this chooses the headline interpretation.
Used with Value B for symmetric difference, absolute difference, and ratio.
For directional change, this is commonly the ending value.
Percent error uses this as the denominator.
Percent error compares this against the true value.
Percent change formula uses start as the base.
Positive output means increase; negative output means decrease.
Formula Breakdown
| Metric | Exact formula | Denominator | Direction kept? | Best use | Zero caution |
|---|---|---|---|---|---|
| Symmetric percentage difference | |a-b| / ((a+b)/2) * 100 | Average of A and B | No | Two peer values with no natural original | A+B cannot be zero |
| Percent error | |measured-true|/true*100 | True or accepted value | No | Lab, forecast, model, or calibration accuracy | True cannot be zero |
| Percent change | (b-a)/a*100 | Starting value A | Yes | Before/after, old/new, or trend movement | Start cannot be zero |
| Absolute difference | |a-b| | No denominator | No | Raw unit gap before converting to percent | Works with zeros |
| Ratio | b/a | Value A | Yes by order | Scale comparison and multiplier checks | A cannot be zero |
| Scenario | A or true | B or measured | Most useful metric | Why it fits |
|---|---|---|---|---|
| Lab mass check | 5.000 g | 5.082 g | Percent error | Accepted mass is the reference base |
| Vendor quotes | 1280 | 1395 | Percentage difference | Neither quote is the original value |
| Before/after weight | 82.4 kg | 79.1 kg | Percent change | The starting value is meaningful |
| Forecast vs actual | 4200 | 4560 | Percent error | Forecast can be treated as reference |
| A/B conversion rate | 4.2% | 4.9% | Percent change | Variant B moved from baseline A |
| Sensor pair | 22.8 C | 23.4 C | Percentage difference | Two instruments are being compared |
| Inventory audit | 250 | 241 | Percent error | Book count is the true/reference value |
| Quality sample | 99.5 | 98.7 | Absolute difference | Pass limits may be in raw units |
| A | B | Absolute diff | Percentage diff | Percent change | Ratio B/A |
|---|---|---|---|---|---|
| 100 | 100 | 0 | 0% | 0% | 1.000x |
| 100 | 110 | 10 | 9.52% | 10% | 1.100x |
| 100 | 90 | 10 | 10.53% | -10% | 0.900x |
| 50 | 100 | 50 | 66.67% | 100% | 2.000x |
| 100 | 50 | 50 | 66.67% | -50% | 0.500x |
| 80 | 120 | 40 | 40% | 50% | 1.500x |
| Step | Symmetric difference | Percent error | Percent change |
|---|---|---|---|
| 1 | Find |a-b| | Find |measured-true| | Find b-a |
| 2 | Find (a+b)/2 | Use true as base | Use a as starting base |
| 3 | Divide difference by average | Divide error by true | Divide directional diff by a |
| 4 | Multiply by 100 | Multiply by 100 | Multiply by 100 |
| Sign | Always nonnegative | Always nonnegative | Positive or negative |
Sometimes you may compare two things only to realize you’ve made a mistake with how you calculated the percent, choosing the incorrect base. It’s more common then many will admit. It’s easy enough to believe that 20% is different when you’re talking about a $100 vs. $120 product, but suddenly it becomes a complete reversal if you switch which one is being compared. It is a twenty percent difference in one direction and a sixteen and two thirds percent difference in the other. That is why having the right way to calculate is so important. And the calculator above does the math for you. No guessing on which formula to use for your unique scenario.
Which brings us to the heart of the matter: Not all percentages are the same. If you have two comparable values (e.g., two measurements from two different sensors, two quotes from two different vendors), then neither value is necessarily the “original.” For those situations, you want a symmetric percentage difference. By definition, it use the average of both numbers as its denominator and guarantees you’ll get the same result no matter how you choose to call one number A and the other B. This approach treats both numbers equally, which is what fairness requires when comparing equals.
How to Choose the Right Percentage
Except that’s only half of the story. When we have a reference point for one of our values, the symmetry are gone. When we compare what happened (actual) to what we expected (prediction), or compare something measured to some accepted standard (e.g., using a lab test to confirm an accepted value), then we’re working with percent error. In this scenario, the accepted/true value become the fixed base. We don’t want to know the gap between two equally-weighted thing: we want to know just how much off-base a particular observation was from the truth. So if we use the symmetric formula here, we’d be diluting the accuracy assessment by halving denominator between the known standard and the messier reality. For someone who needs to trust the quality of the data, that’s a big difference… It means your error margin can look artificially smaller, or reflect its proper size.
With time, direction counts Any time you’re looking at something where the trend spans multiple periods. Such as traffic to your site, stock prices, or your own body weight, you want to know directional percent change. That’s when you take the starting point as your base and not only get an idea of how much things changed, but which way it went. A negative number in this case doesn’t mean there’s anything wrong with the calculation, it means that the thing you’re measuring went down. The calculator will do all that for you, but knowing why we use the beginning as our anchor will help you read the numbers correctly. For instance, falling 10% and rising 10% aren’t equal-sized changes because the starting numbers is different sizes.
Numbers are also deceptive without context. For example, raw numbers can show the actual amount of money or physical distance between two points. This can be useful for things like engineering tolerances and budgets. However, it lacks scale. Ten dollars might be catastrophic on your ten dollar lunch bill, but it’s trivial on your million dollar contract. Ratios help fill in the gap because they show how much more or less a single value multiplies into something else. It gives you a naturaly sense of scale. This helps you know that one thing is 1.5 times bigger than another, even if there is a large swing in values that percentages can sometimes hide.
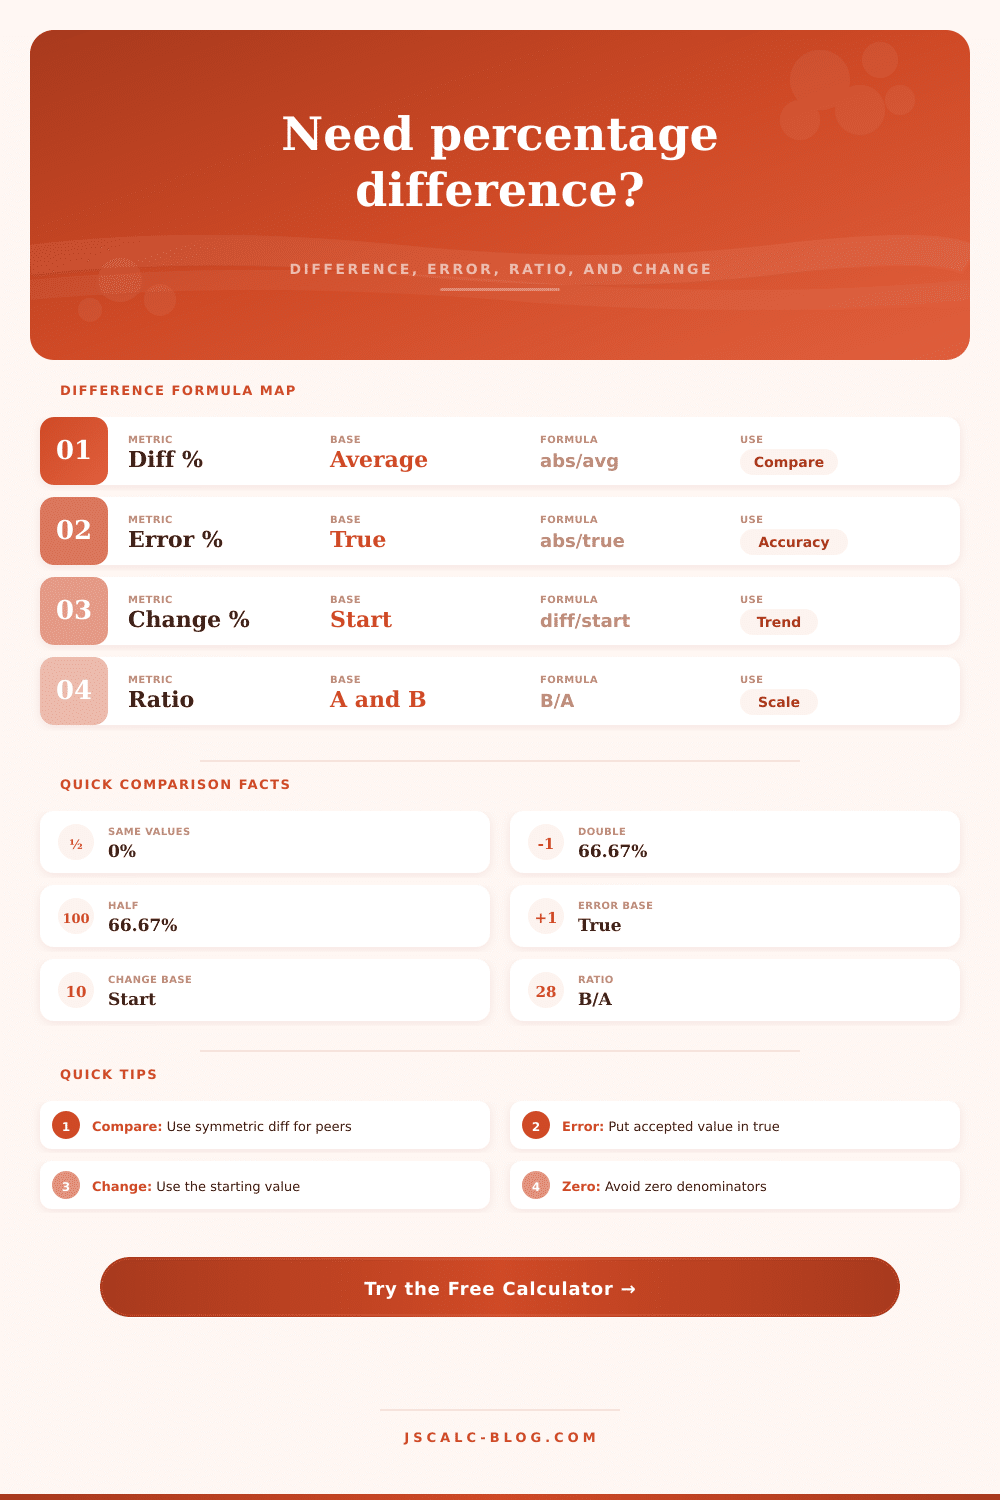
The choice of metric boils down to determining your baseline. What’s the start? What’s the standard? Who’s the peer? If there’s no natural anchor for you, choose the symmetric average. If you’re aware of some sort of truth that you can compare against, choose error. If you’ve got a timeline in mind, choose change. The page contains a handy reference table, but more importantly, it provides the intuition. With knowledge of what you’re dividing by, the rest of the math follows naturaly. Stop guessing, and start measuring with intent.
You should of used this earlier.