Partial Eta Squared Calculator
Calculate partial eta squared from ANOVA sums of squares or from an F statistic and degrees of freedom, then convert the result to Cohen f.
Use this when your ANOVA table reports effect SS and error SS.
Benchmarks are descriptive and should not replace field norms.
Use the row for the effect, factor, covariate, or interaction.
Use the matching residual or error term for that effect.
Use the reported F value for the same ANOVA row.
Numerator degrees of freedom; optional for SS, required for F.
Denominator degrees of freedom; optional for SS, required for F.
Optional benchmark, prior study, or minimum effect of interest.
Use more decimals for small effects near zero.
| ANOVA term | Input source | Required values | Partial denominator | Output range | Best reporting use |
|---|---|---|---|---|---|
| Main effect | SS table | SS effect, SS error | Effect plus matched error SS | 0 to under 1 | Report as partial eta² with factor df and error df when available |
| Main effect | F table | F, df effect, df error | F × df effect plus df error | 0 to under 1 | Recover an effect size from published ANOVA summaries |
| Interaction | SS table | SS interaction, SS error | Interaction SS plus matching residual SS | 0 to under 1 | Use the specific error term for that interaction |
| Within-subject factor | Repeated measures table | Effect SS, effect error SS | Effect plus within-subject error SS | 0 to under 1 | Report alongside correction method if sphericity was adjusted |
| Covariate | ANCOVA table | SS covariate, SS error | Covariate SS plus model error SS | 0 to under 1 | Describe variance controlled by the covariate within the model |
| Planned contrast | F contrast | F, contrast df, error df | Contrast F term plus error df | 0 to under 1 | Useful when the contrast has its own F statistic |
| MANOVA follow-up | Univariate ANOVA | Follow-up F or SS row | Effect-specific denominator | 0 to under 1 | Keep each dependent variable clearly separated |
Benchmark Lookup
| Label | Partial eta² | Percent partial variance | Cohen f | Plain reading |
|---|---|---|---|---|
| Very small | under 0.01 | under 1% | under 0.10 | Effect is below the conventional small benchmark |
| Small | 0.01 to 0.059 | 1% to 5.9% | 0.10 to 0.25 | Visible but usually modest in practical terms |
| Medium | 0.06 to 0.139 | 6% to 13.9% | 0.25 to 0.40 | Clear share of partial model variance |
| Large | 0.14 to 0.259 | 14% to 25.9% | 0.40 to 0.59 | Strong effect by common ANOVA convention |
| Very large | 0.26 or more | 26% or more | 0.59 or more | Large enough to deserve design and context checks |
Common Reported F Examples
| Reported F | df effect | df error | partial eta² | Cohen f | Benchmark |
|---|---|---|---|---|---|
| 2.15 | 1 | 58 | 0.036 | 0.193 | Small |
| 4.80 | 2 | 92 | 0.094 | 0.322 | Medium |
| 6.10 | 3 | 87 | 0.174 | 0.459 | Large |
| 9.25 | 1 | 44 | 0.174 | 0.459 | Large |
| 12.40 | 4 | 116 | 0.299 | 0.653 | Very large |
| 18.70 | 2 | 64 | 0.369 | 0.765 | Very large |
SS Example Lookup
| Effect SS | Error SS | Denominator | partial eta² | Percent |
|---|---|---|---|---|
| 8 | 792 | 800 | 0.010 | 1.0% |
| 32 | 501 | 533 | 0.060 | 6.0% |
| 48 | 342 | 390 | 0.123 | 12.3% |
| 98 | 602 | 700 | 0.140 | 14.0% |
| 156 | 444 | 600 | 0.260 | 26.0% |
| 245 | 455 | 700 | 0.350 | 35.0% |
So you run an analysis of variance and it’s significant. Great! But you don’t know anything except that from that single test result. A small difference can be statistically large with a big enough sample, which is why we want to understand effect sizes.
Partial eta squared does just that, it converts the meaningless statistical noise of significance testing (which is highly dependent on sample size) to something meaningful: the proportion of variance explained by a factor. P-values never tell us much about how big the difference is; partial eta squared do. It’ll take those F stats or raw sums of squares from whatever program you’re using and convert them for you into a proportion of variance explained, but what does that number realy mean?
What is Partial Eta Squared?
The calculator on this page will do all of that for you, but I figured I’d put some context around what the number actualy represents.
In simple terms, partial eta squared isolates how much of the variance is explained within a model by one single factor (effect). It does this without taking into account any other variation due to other factors in the model. Partial means that it doesn’t include all the variation in the data set, just the portion that’s relevant to the factor/ effect being measured as well as the matching error term.
Why is this important? Because with a complicated design, you can look at each part on its own. Your ANOVA table will have rows for your main effects, interactions, and error terms, depending on the analysis you perform.
For a particular effect you want to calculate partial eta squared for, you subtract the sum of squares for that effect from the total sum of squares. Then you divide that value by the sum of squares for the effect + its own error term. So you’ll have to identify which row(s) in your output table correspond to the effect and its error. The calculator above should do all this for you, it will save you from having to do the division yourself, but you’ll still have to select the correct rows from your output table.
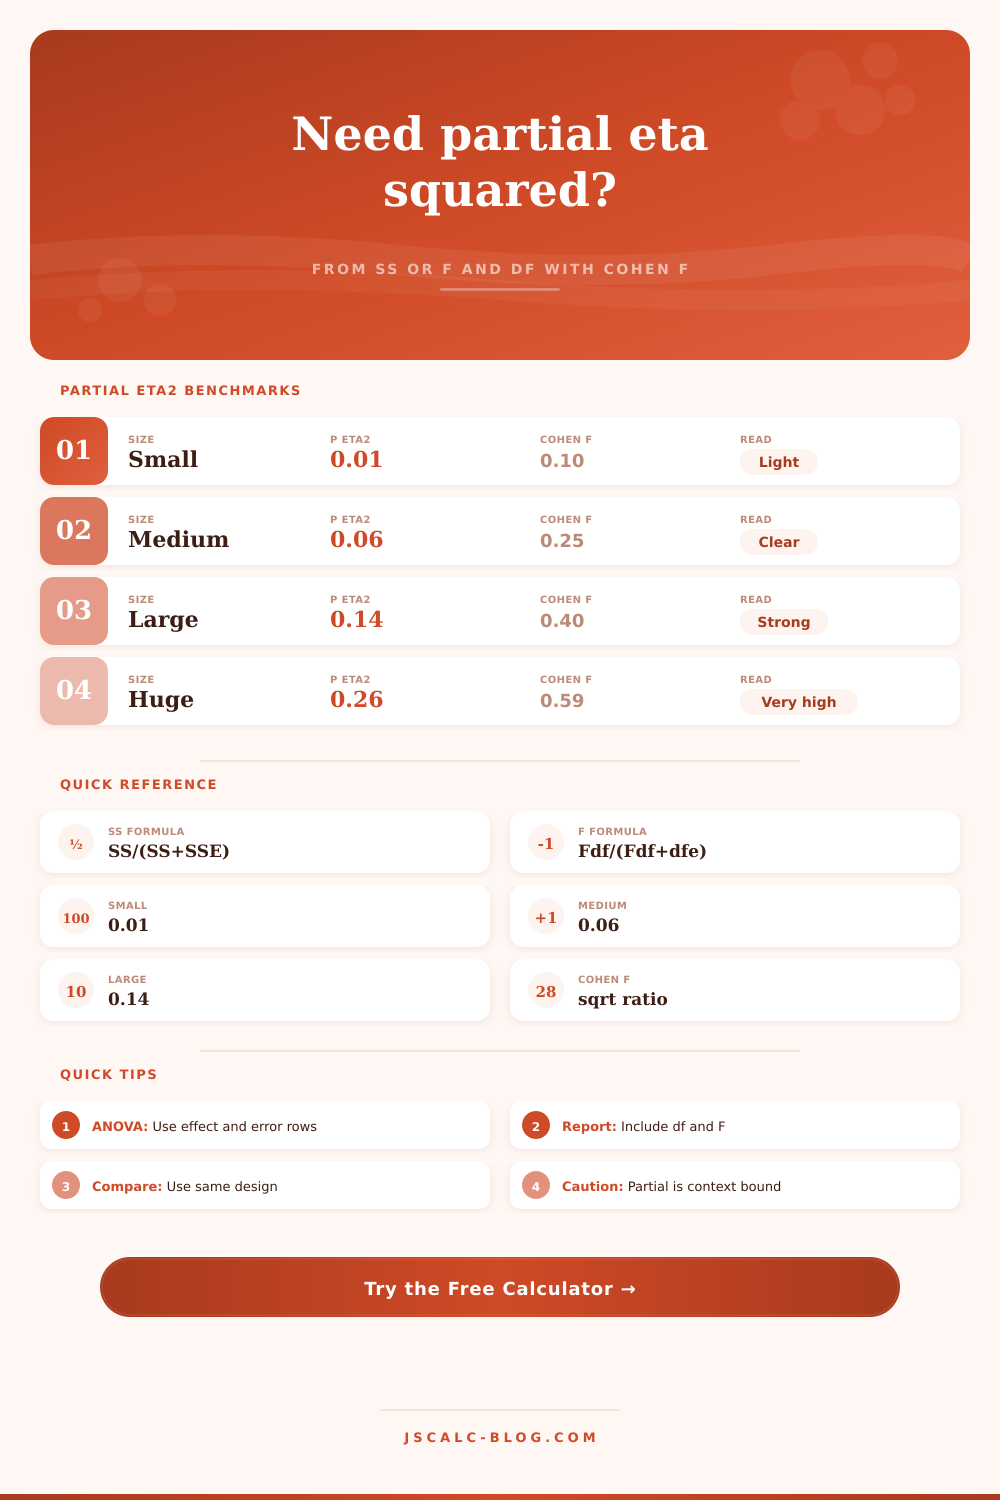
To make sense of these figures, researchers typically use standard benchmarks. For example, Cohen suggested that if the effect size were about 0.01 it’s considered small; 0.06 medium, and 0.14 large. These aren’t laws of nature by any means. They’re simply a shared language for discussing findings from study to study.
What seems like a small effect could easily be statistically significant in a large experiment but completely useless in practice. And what counts as a large effect is relatively uncommon in most social science settings and can indicate either a strong phenomenon, or a problem with how the data was collected.
The page also includes a reference table of benchmarks and their Cohen f values. These are useful because different fields or even different journals tend to favor one metric more then the other. Cohen f is simply a re-expression of the same ratio at a different scale. However, don’t mistake partial eta squared as some kind of universal truth. The metric is tied to the particular model that was run. Even if there is the same relationship between variables, changing the design or adding covariates can change the value. That’s why you always should report the F statistic and degrees of freedom along with the effect size. Other researchers will be able to recreate what you found and determine the magnitude.
P-values are tempting for many folks because they act like a simple yes or no. However, the effect size shows just how much variance your predictor has been able to capture. In practice, it’s possible that your big result actualy has a tiny partial eta squared.
Does that mean you’ve failed? Not necessarily. It could be that the effect is subtle. It could also indicate that there was another factor that was responsible for most of the variance, but which wasn’t measured. Or maybe you had such a small sample that your study was simply underpowered. This means you missed a real signal because your sample size was to small. The tool lets you see that trade-off nicely.
If your paper doesn’t report sums of squares, then it may instead have reported the F value and degrees of freedom: just plug them into the tool and you’ll get the same answer.
So there you have it: Partial eta squared is that bridge from statistical significance to practical significance. It compels you to consider the question of just how meaningful this difference is. Is it a big enough difference? Whether it’s a new product feature, a therapeutic intervention, or a new teaching method, in many cases, the “how big” matters far more than knowing for sure that it exists.
Converting your ANOVA output into proportional terms helps you get a better read on what your data realy means. Did you detect anything? Yes. Is what you did detect worth building upon? That’s what the effect size tells you. And that’s what most people miss: they focus on whether they detected it, but not on the magnitude (i.e., whether it matters).
In conclusion, sometimes you can detect a small effect with a lot of certainty. This isn’t as useful as detecting a larger one with a bit more uncertainty. It all depends on what you’re trying to prove.