Omega Squared Calculator
Estimate ANOVA ω² from sums of squares or from an F statistic, then compare the adjusted result with eta squared and epsilon squared.
🎯Omega Squared Presets
🧮ANOVA Inputs
Use the ANOVA table when you have sums of squares; use F mode for published summaries.
Sampling noise can make adjusted estimates slightly negative near a null effect.
Between-groups or term sum of squares for the effect.
Numerator degrees of freedom for the ANOVA effect.
Mean square error, usually SS error divided by df error.
Total corrected sum of squares from the ANOVA table.
Used in F mode, with df effect and df error.
Denominator degrees of freedom for F and partial comparisons.
🔢Current Effect Snapshot
📐Formula Breakdown
📊Effect Size Formula Comparison
| Measure | Core Formula | Denominator | Bias Adjustment | Typical Size | Main Caution |
|---|---|---|---|---|---|
| Omega squared | (SS effect - df x MSE) / (SS total + MSE) | Total plus MSE | Subtracts df x MSE | Lower than eta | Can be negative near zero |
| Epsilon squared | (SS effect - df x MSE) / SS total | Total SS | Subtracts df x MSE | Near omega | Slightly larger than omega |
| Eta squared | SS effect / SS total | Total SS | None | Largest | Upward bias in samples |
| Partial eta squared | SS effect / (SS effect + SS error) | Effect plus error | None | Often larger | Not the same scale as eta |
| F omega approx | df1 x (F - 1) / (df1 x F + df2 + 1) | F and df only | Subtracts null F of 1 | Approximate | Needs correct df pairing |
| F eta approx | df1 x F / (df1 x F + df2) | F and df only | None | Partial eta | Not full eta squared |
🧪Preset ANOVA Values
| Scenario | Mode | SS Effect | df Effect | MS Error | SS Total | F | df Error | Expected Reading |
|---|---|---|---|---|---|---|---|---|
| Teaching methods | SS | 48.0 | 3 | 4.1 | 390.0 | 3.90 | 84 | Small to medium classroom effect |
| Therapy groups | SS | 126.4 | 2 | 7.8 | 680.5 | 8.10 | 93 | Moderate symptom difference |
| Fertilizer trial | SS | 31.2 | 4 | 3.6 | 244.7 | 2.17 | 55 | Small adjusted plant response |
| UX task time | F | 0 | 2 | 0 | 0 | 12.50 | 141 | Moderate interface effect |
| Employee training | F | 0 | 3 | 0 | 0 | 4.80 | 116 | Small knowledge-score effect |
| Dose response | F | 0 | 5 | 0 | 0 | 6.35 | 174 | Moderate multi-dose pattern |
| Small F warning | F | 0 | 3 | 0 | 0 | 0.82 | 68 | Raw estimate below zero |
| Machine settings | SS | 84.7 | 5 | 2.9 | 512.2 | 5.84 | 120 | Medium process setting effect |
| Large class study | F | 0 | 4 | 0 | 0 | 2.95 | 320 | Small but stable effect |
📏Magnitude Benchmarks
| Omega Squared | Label | Variance Reading | Plain-Language Cue | Reporting Reminder |
|---|---|---|---|---|
| Below 0.01 | Very small | Less than 1% | Effect is hard to see on the outcome scale | Still report exact value if planned |
| 0.01 to 0.059 | Small | About 1% to 6% | Modest group separation | Context decides practical value |
| 0.06 to 0.139 | Medium | About 6% to 14% | Clearer ANOVA effect | Check pairwise follow-up separately |
| 0.14 to 0.249 | Large | About 14% to 25% | Strong share of explained variance | Verify model and assumptions |
| 0.25 or more | Very large | 25% or more | Dominant effect in the model | Inspect design and measurement range |
| Negative raw | Near zero | Report as 0 often | Adjustment exceeded observed signal | Say whether clamped or raw |
🔍F Approximation Lookup Grid
| df Effect | df Error | F | Omega Approx | Eta Approx | Epsilon Approx |
|---|---|---|---|---|---|
| 1 | 40 | 2.50 | 0.035 | 0.059 | 0.035 |
| 2 | 60 | 3.20 | 0.065 | 0.096 | 0.066 |
| 3 | 87 | 5.82 | 0.143 | 0.167 | 0.146 |
| 4 | 120 | 2.95 | 0.061 | 0.090 | 0.062 |
| 5 | 174 | 6.35 | 0.149 | 0.154 | 0.150 |
| 2 | 141 | 12.50 | 0.137 | 0.150 | 0.138 |
| 3 | 68 | 0.82 | -0.007 | 0.035 | -0.008 |
| 6 | 240 | 4.10 | 0.070 | 0.093 | 0.071 |
💡Actionable Omega Squared Tips
ANOVA is done: You run the test and get a significant F statistic. Your peers are impressed, the p-value is tiny, and yet… does it matter? Calculate omega squared, which helps you answer that question by eliminating impact of sample size to demonstrate how much of the variance the independent variable accounts for.
Simply put, a larger value tells you that the variable account for more variance, though you still need to consider outside context like cost and side effects to know if the difference is actualy important in the real world.
Why Omega Squared is Better Than Eta Squared
To do the math, simply input either the F value(s) or sum of squares into the calculator above, and it will do all the hard work for you, no messy denominators to worry about here!
Eta squared is simpler to compute which is why most researchers rely on it. Essentially, you divide the sum of squares for the effect by total sum of squares. That’s clean, straight forward, and that’s where things get dicey. Eta squared is biased. Specifically, if your model is complex, or your sample size are small, then eta squared will overestimat the effect in the population.
This is where omega squared comes in. It corrects for this bias by taking into account the mean square error in the numerator. This means there is a penalty for the number of degrees of freedom employed. It separate signal from the cost of parameter estimation.
This difference shows itself in the input form. For an ANOVA table (assuming you have one), you input total sum of squares, the sum of squares for the effect, the degrees of freedom, and the mean square error. From there, the tool will compute adjusted variance.
Switch to F mode if all you have to go by is what was reported in a paper… Just the F statistic. Here, it relies on an approximation using your degrees of freedom and the F value. That’s still more accurate then guesswork, though not quite as precise as raw sums of squares.
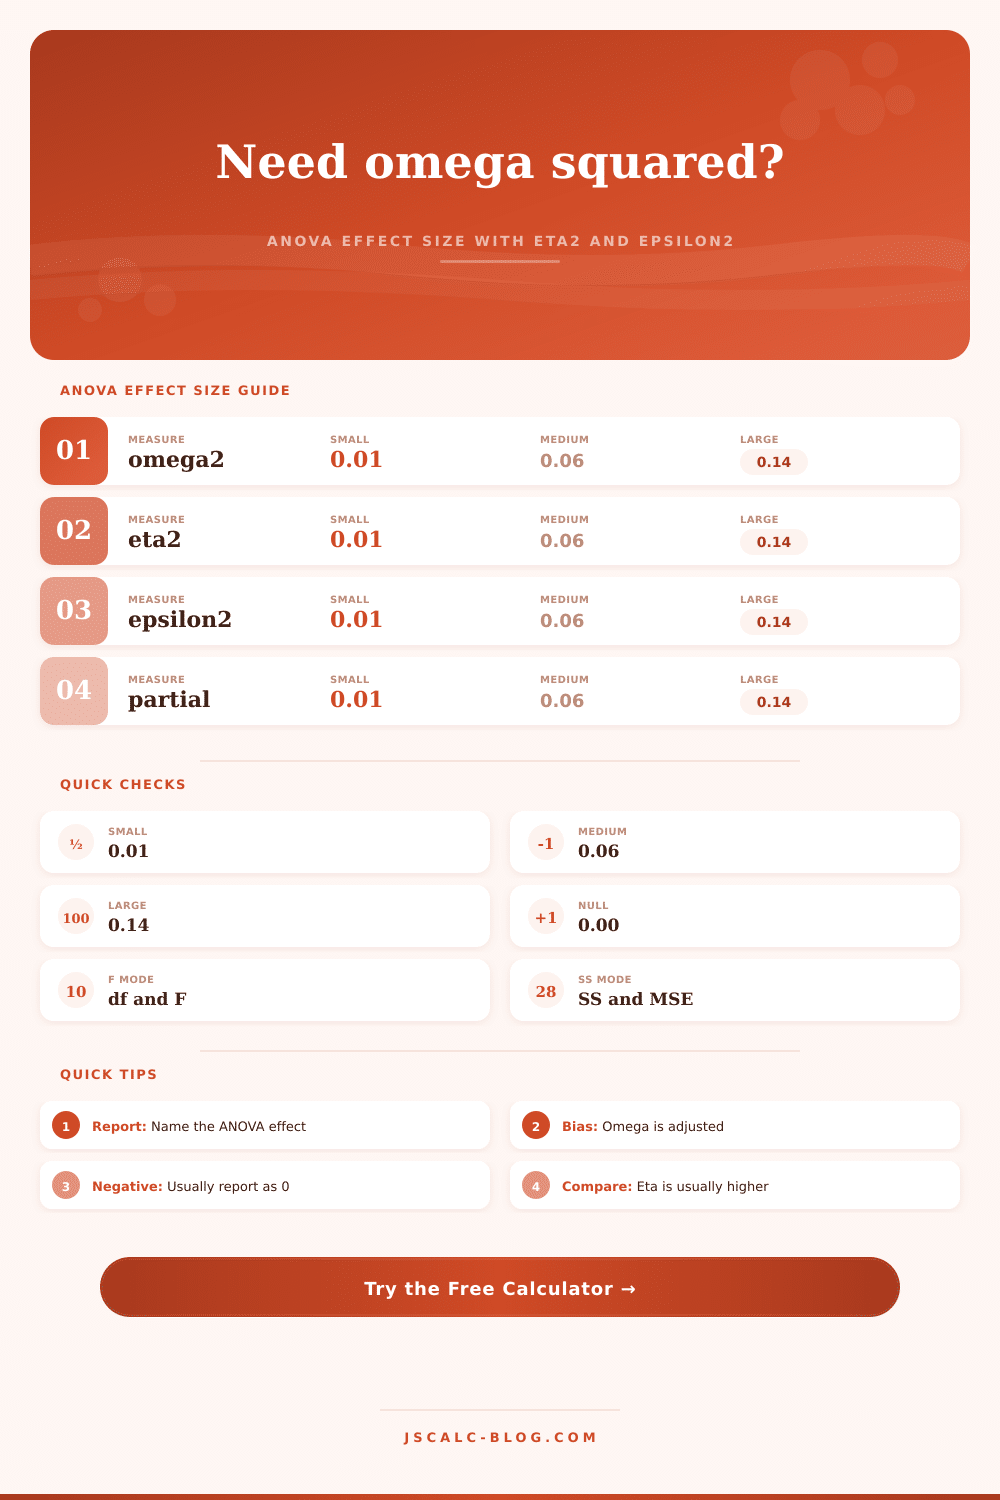
Finally, the reference table at the bottom indicates that an omega squared of.01 is considered small,.06 is medium, and.14 is large. They’re not hard-and-fast rules, but they do serve as helpful anchors.
In other cases, it’s a negative number. That can be scary on your spreadsheet. Typically, that shows that you saw an effect smaller than you’d expect to see by chance alone. The sampling distribution crossed into the negatives.
Most guides recommend clamping those values at zero. There isn’t any such thing as negative variance out in the real world. You can have the tool show you the raw negative estimate, or clamp it down to zero. I think that’s a preference, though the result is the same. The effect are negligible.
Let’s compare eta squared and omega squared. You’ll notice that eta squared is consistently larger than omega squared. That’s because eta squared contains the part you’ve subtracted (i.e., the bias). This difference can be significant in small sample size. As sample size increases, the distinction becomes smaller.
Epsilon squared falls somewhere in-between with the same denominator (total sum of squares) but different numerator. Essentials, it’s a little less conservative than omega squared. Some fields prefer one statistic over another. Psychology seems to lean toward partial eta squared, which is even more inflated.
Omega squared demands greater humility. And rightly so, it serves as a reminder that the model is only a snapshot; it isn’t the full picture. Those numbers mean different things when put in context.
A large effect in a tightly controlled lab experiment might translate to a trivial difference in a noisy field setting. A small effect in a national survey can still affect millions of people. Knowing the number alone doesn’t tell you whether or not the intervention should be funded. It only tells you how much variance it accounts for.
Consider the outside world: what’s the baseline risk? What are the side effects? What’s the cost of the treatment? Even a statistically significant difference in a trivial outcome is a trivial finding.
To illustrate this, we can use the calculator’s presets to see alternative possibilities. Each has its own baseline expectations: the method for teaching math, the trial for applying fertilizer, and the group therapy session.
Perhaps UX task time shows a modest impact. That may translate into seconds shaved off a task, across thousands of users. Dose response exhibits a strong effect. Strong biological forces is at play here. These are real world instances where effect size serves as a yardstick for impact rather than an abstract number.
Leave your p-values in the dust
P-values say nothing about importance; they just report whether the data were unusual. Omega squared makes this clearer. It accounts for number of groups and sample size. The interpretation stays honest.
When you encounter a statistically significant F test, check out the variance explained. Is it close to zero? Congratulations (on being precise rather than powerful). Now you know the difference between signal and noise. That’s the gold mine.