Outlier Detection Calculator
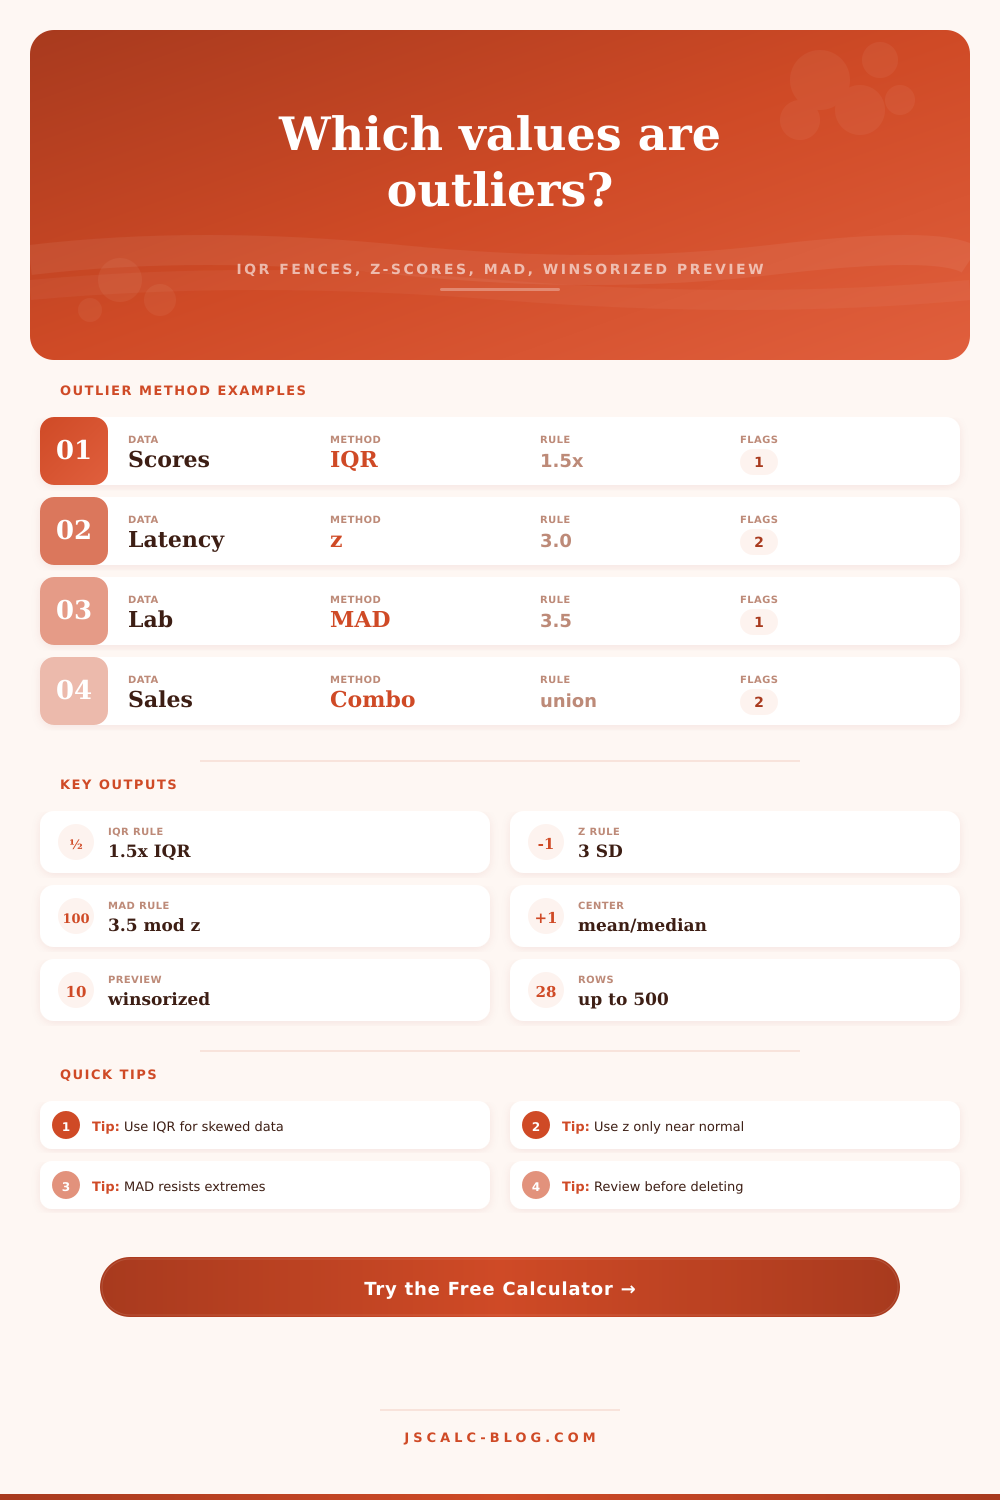
Paste a numeric dataset to compare IQR fences, ordinary z-score thresholds, MAD modified z-scores, outlier counts, and a winsorized preview on JSCalc-Blog.com.
Load a realistic dataset, then adjust method, thresholds, quartile rule, winsorization behavior, row count, unit label, and rounding.
Enter at least three values to compare outlier methods.
| # | Value | IQR flag | Z score | MAD score | Primary status |
|---|---|---|---|---|---|
| Results appear after calculation. | |||||
| Method | Formula | Best use | Weakness | Current threshold |
|---|---|---|---|---|
| IQR fences | Q1 - k x IQR and Q3 + k x IQR | Skewed or non-normal data | Quartile method can shift small samples | 1.5 x IQR |
| Z-score threshold | z = (x - mean) / sample SD | Roughly normal data without heavy skew | Mean and SD move when extremes exist | abs(z) > 3 |
| MAD method | modified z = 0.6745 x (x - median) / MAD | Robust screening with extreme values | Needs a zero-MAD rule for repeated data | abs(mod z) > 3.5 |
| Union rule | Flag when any selected detector fires | Conservative review lists | May create more false positives | Any method |
| Intersection rule | Flag when two or more detectors fire | High-confidence review lists | May miss one-method extremes | 2+ methods |
| Metric | Original data | Winsorized preview | Change | Interpretation |
|---|---|---|---|---|
| Winsorized results appear after calculation. | ||||
| Scenario | IQR multiplier | Z threshold | MAD threshold | Practical note |
|---|---|---|---|---|
| Standard screening | 1.5 | 3.0 | 3.5 | Good first-pass review setting |
| Extreme-only screen | 3.0 | 4.0 | 5.0 | Flags fewer values for audit lists |
| Tight teaching example | 1.0 | 2.5 | 3.0 | Useful for showing method sensitivity |
| Skewed operational data | 1.5 to 2.0 | Avoid alone | 3.5 | Favor robust methods over mean-based z |
| Small samples | Report method | Use care | Use care | Manual context matters below n = 10 |
| Repeated flat values | Works if IQR positive | May be zero SD | Needs zero-MAD rule | Use the table notes before removing values |
Sometimes there’s one number in the middle of all these numbers and they looks like a perfectly good set of data. Except then you see it: its a typo. Or it’s an outlier. It is a true anomaly. It is something that completely shifts story. And it makes all the difference.
Delete that real event because it seemed strange? Lost information. Keep that sensor error? Drifted off average. Outlier detection isn’t about finding junk data. Its about dealing with unusual.
How to Find Outliers in Your Data
The calculator above can runs the equations for you. But knowing which method flags which value, that’s the actual work.
The z-score is the one most people begin with because it seems like the intuitive choice. Here’s mean. Here’s the standard deviation. How far away from that do you sit? And if your data is nicely shaped into a bell then this will work out just fine.
This is where people go astray. Mean and standard deviation aren’t rock-solid stats. Extreme points makes them budge around. A huge outlier pull the average towards itself. It stretches the spread apart. Now all of a sudden that high outlier appears less extreme than it realy is. The process obscures what you want to uncover.
That’s where the interquartile range help. It doesn’t use the average. Rather than using all your data, it focuses on middle fifty percent. It draws fences around this core group. Anything beyond the fences gets flagged. Since it doesn’t look at the tails, it is far more difficult to trick.
Notice that you can adjust the multiplier used by this tool for the fences? The default is one and a half times the interquartile range. This is a decent starting place to begin screening in general. Making the multiplier smaller will result in just about everything being flagged. Increasing the multiplier results in only most extreme cases getting caught. How nosy your data tends to be determine which option makes sense.
But if you’re working with messy, skewed data (as most of us do), then your best friend may be median absolute deviation. This is because it’s measuring how far away something is from the median, not the mean. And the median are stubborn. A million isn’t going to budge it as much as a single hundred but it doesn’t matter. The median remains firm. This means that an outlier will be called out by the modified z-score based off the robust center, and it won’t get pulled off course by extreme values.
The more you think your data is normal, the less helpful the modified z-score will be… Since it’s great at finding outliers in data with heavy tails or just data that’s not normal in general.
Not only does the calculator do the math with coefficients for you, it allows you to concentrate on what the numbers are telling you instead of thinking about the equation behind it. Very few is going to align with all the methods. Some will highlight a value that none of the others caught. Don’t worry: that’s not a bug! It’s a feature. It’s a signal that there’s some sort of strange shape in your distribution.
The union option says “any method caught this, so we’ll flag it.” That’s conservative. Less precision, more recall (you’ll get fewer false alarms but you’ll also miss fewer things that are actualy an issue). The intersect option says “all methods agree,” or something like that. That’s high confidence and low volume. There is fewer false alarms, but you may miss some subtle anomalies. Choose whichever works best depending on how expensive it is to check a point. If five seconds per data point is reasonable, go conservative; if it costs money, go selective.
Another thing I think is helpful is Winsorization. It doesn’t delete your outliers. Instead, it clamps them to the closest non-outlier point. This shows you what your summary stats might look like with their extremes capped off. This helps you understand how badly those few points is skewing your perspective.
There’s a great table of reference on the page that walks through this and shows where the cutoffs move, from standard screening to super-tight teaching examples. Use it as a rough guide for sensitivity before committing to anything.
Only you know your context. Maybe a low number was an aberration due to a holiday, or maybe it’s a stockout event, something critical for you to understand. The numbers are your guides, but your judgement is what decides. Look at the flags, look at the trimmed impact then look at why this point stands out from others. And then decide.