Margin of Error Calculator
Calculate margin of error for a sample proportion or sample mean, apply optional finite population correction, and estimate the sample size needed for a target precision.
Load a realistic polling, survey, research, or measurement scenario, then adjust confidence level, sample size, population size, and target margin.
Enter sample details to calculate margin of error.
| Item | Symbol | Current value | Formula role | Result note |
|---|---|---|---|---|
| Enter inputs to see the current calculation. | ||||
| Confidence | Alpha | Two-sided z | Relative width | Typical use |
|---|---|---|---|---|
| 80% | 0.20 | 1.282 | 0.65x of 95% | Fast directional screening |
| 85% | 0.15 | 1.440 | 0.73x of 95% | Exploratory internal checks |
| 90% | 0.10 | 1.645 | 0.84x of 95% | Business surveys and pilots |
| 95% | 0.05 | 1.960 | Baseline | Common public reporting level |
| 98% | 0.02 | 2.326 | 1.19x of 95% | More conservative reporting |
| 99% | 0.01 | 2.576 | 1.31x of 95% | High-confidence decisions |
| 99.5% | 0.005 | 2.807 | 1.43x of 95% | Strict confirmation work |
| 99.9% | 0.001 | 3.291 | 1.68x of 95% | Very conservative estimates |
| Mode | Margin formula | Sample size formula | Best inputs | Caution |
|---|---|---|---|---|
| Proportion | MOE = z * sqrt(p(1 - p) / n) | n0 = z^2 p(1 - p) / e^2 | Survey share, response rate, conversion rate | Use p = 0.50 when planning with no prior estimate |
| Mean | MOE = critical * s / sqrt(n) | n0 = (critical * s / e)^2 | Sample SD, mean, units, completed observations | Small samples may need a t critical value from a separate table |
| FPC factor | sqrt((N - n) / (N - 1)) | n = n0 / (1 + (n0 - 1) / N) | Known population, sampled without replacement | Do not use for open-ended or replacement sampling |
| Interval | Estimate +/- MOE | Width = 2 * MOE | Observed proportion or mean estimate | Margin does not include nonresponse or weighting error |
| Response plan | Invites = target n / response rate | Round invitations up | Expected response rate from past fielding | Low response rates can add bias beyond sampling error |
| Worst case p | p(1 - p) is largest at 0.50 | Produces maximum required n | Early survey planning | Known p far from 0.50 can need fewer responses |
| Target margin | 90% confidence | 95% confidence | 99% confidence | Planning note |
|---|---|---|---|---|
| +/- 10% | 68 | 97 | 166 | Rough screening sample at p = 50% |
| +/- 7.5% | 121 | 171 | 295 | Useful for early internal reads |
| +/- 5% | 271 | 385 | 664 | Common survey planning target |
| +/- 4% | 423 | 601 | 1037 | Narrower poll or segment estimate |
| +/- 3% | 752 | 1068 | 1844 | Typical national poll precision |
| +/- 2% | 1691 | 2401 | 4148 | High precision for key tracking |
| +/- 1% | 6765 | 9604 | 16588 | Large-scale measurement work |
Take as an example: A national poll say that a candidate is ahead by five percentage points, while the poll has a three percent margin of error. You see it in headlines but what’s really true is in fine print. Those three percent don’t tell us anything about potential bias; nor do they tells us anything about which one is likely to win.
Instead, those three percent reflect a limit of doubt. That is, the maximum amount by which the outcome might differ if you were to repeat the survey on another random Tuesday.
Understanding the Margin of Error
That’s the difference between being read by stats vs reading stats. Once you enter your confidence level and sample size into calculator above, it do the math for you. No need to guess at whether your results represent something real, or simply noise.
The margin of error is often treated by most readers as some sort of inherent characteristic of the survey, like color of ink used on the ballot. It’s not. How large the margin is depend directly on number of people you actualy ask, and on your confidence level in final result.
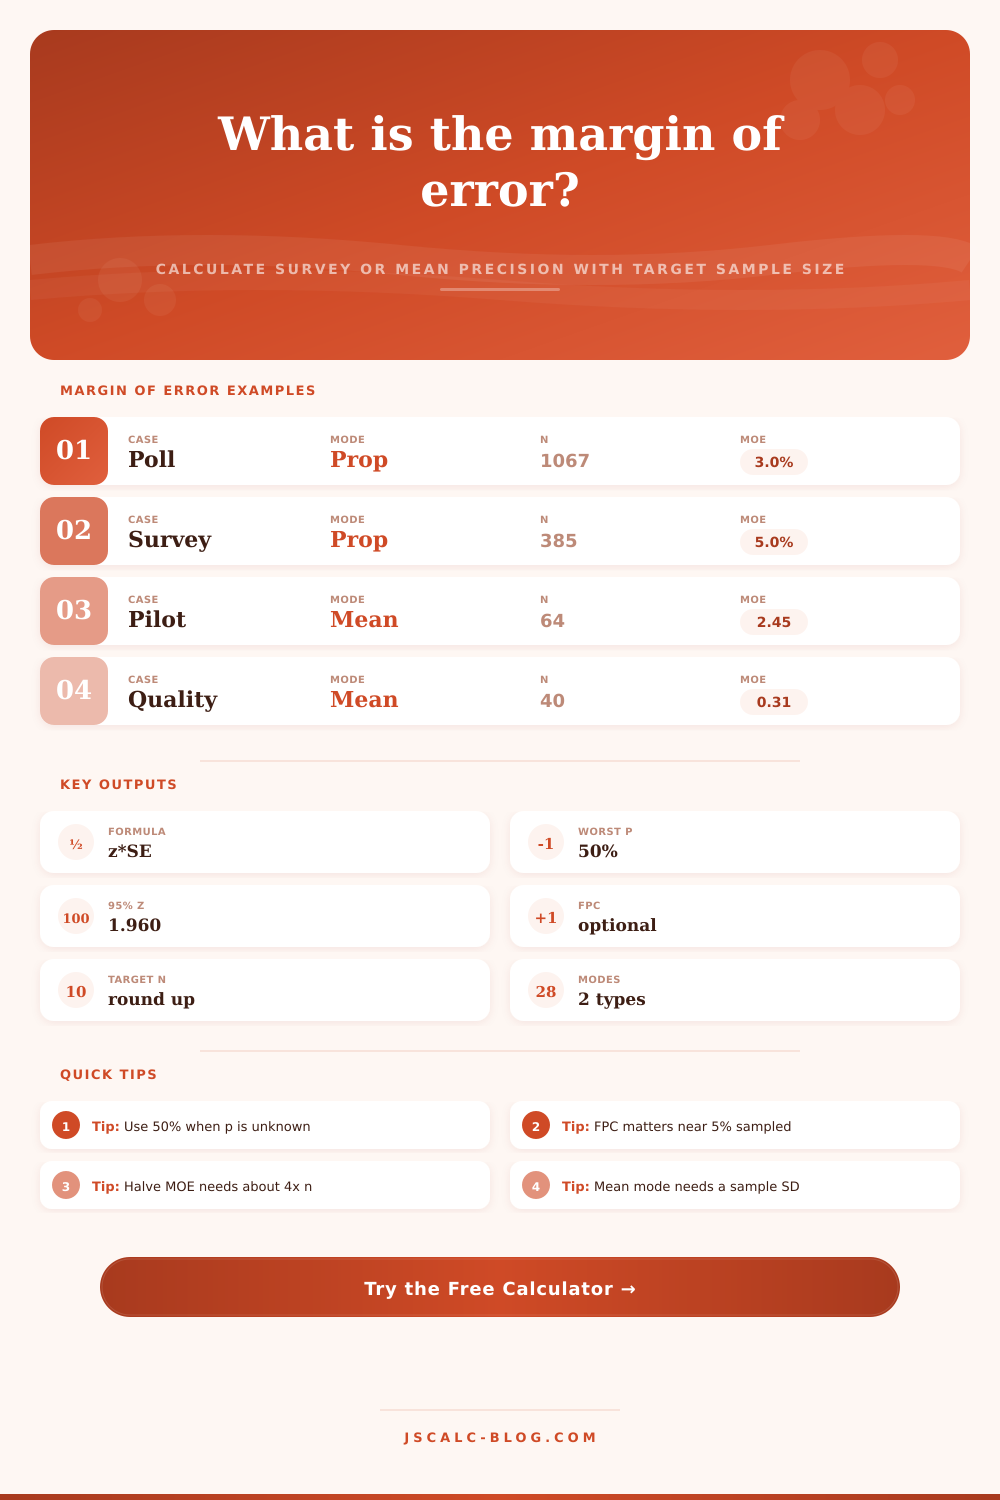
Bigger samples reduce the margin, but they don’t do so in a linear fashion. For instance, the margin halve with a four times larger sample. That’s a pretty steep tradeoff… And one that traps a lot of researcher. They assume that double the interviews means half the error. The math doesn’t work more better than that way.
The calculator makes this tradeoff clear (see how many more respondents you’ll have to include for that additional precision). But also note their confidence level setting. This determine what proportion of the time they expect the interval to contain actual population value.
Most public polls is reported at a 95% confidence level, which is about as good a compromise between practicality and precision as you can get. Go up to 99%, though, and the margin of error is going to spread dramaticly. This is the tradeoff; we are giving up precision for certainty.
When you’re talking about razor-thin leads, it matter when decisions depend on these results. Look down the page at reference table which shows all of this, explaining how much the critical value jumps as you push for more assurance. Do you want greater assurance you’re right or do you want to know the number closer?
There’s another layer to this: the size of the population itself. When doing big polling of the whole country, the population is so huge that the finite population correction factor are unimportant. Suppose you are polling a smaller pool, like your company with its two hundred employee. That number matters. That factor show that after interviewing half the sample, you know a good deal about the remainder. It shows that ignoring the factor overstate the error. And using it where inappropriate understate the amount of uncertainty.
When you specify a known population, this tool will apply the correction for you and report results in line with how much of your sample frame you’ve actualy sampled from.
How it works: When calculating how many people are needed (a process called “sample size calculation“), planners assumes worst case: A 50-50 split, where variance is highest and uncertainty is at its peak. That’s why they always plug in half into their formulas. But if an issue is one where everyone agree, or is very polarizing, then you don’t need as big a sample. The math takes all that into account. You can also specify your own baseline percentage, which will help refine the answer.
Generic calculators will always tell you the same thing based off the 50% input. And lastly, keep in mind that this margin of error is just for random sampling error. It doesn’t correct for other types of errors such as non-random sampling (meaning the sample isn’t representative), leading questions, and poor response rates.
You might get a really small margin of error on a survey, yet still be entirely incorrect because your respondents aren’t similar to those who didn’t respond. Your method determines what you’re measuring; the math puts a bound around it. You should of known that distinction when reading about the latest poll in the headlines. The number will tell you how precisely they measured it, not whether it was accurate.
That three percent margin isn’t a map boundary… It’s merely the edge.