Living Space Per Person Calculator
Estimate adjusted usable floor area, bedrooms per resident, target occupancy gap, and density category with this JSCalc-Blog.com planning calculator.
🏘Real Household Presets
📏Living Space Inputs
📊Current Planning Snapshot
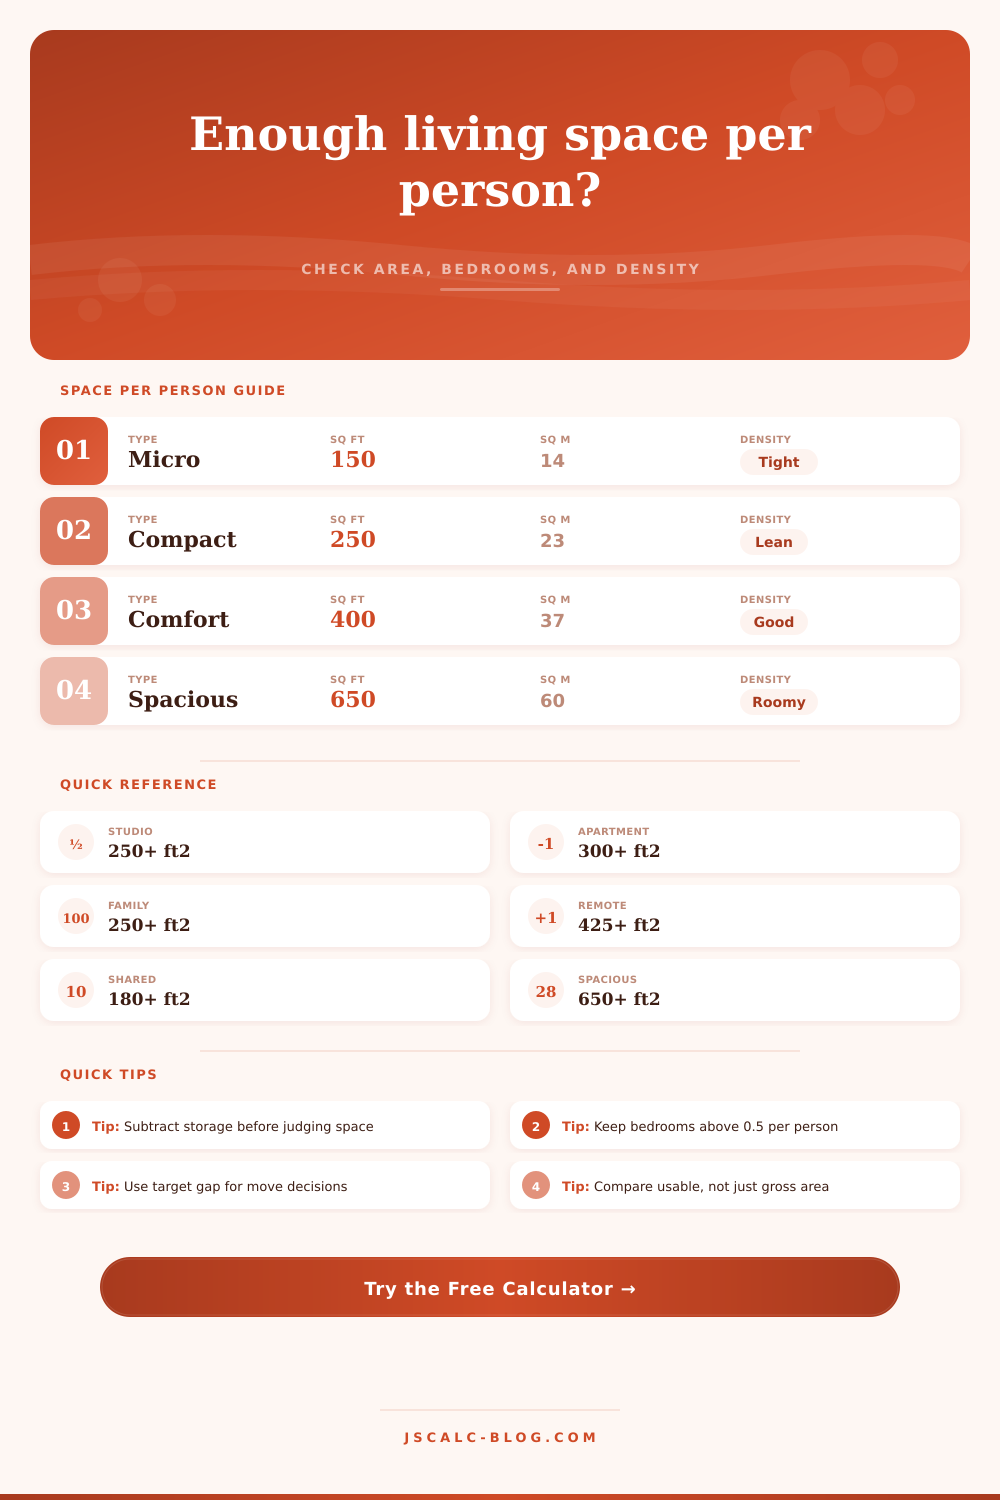
📐Space Per Person Reference
| Category | Usable sq ft/person | Usable sq m/person | Typical feel | Best fit |
|---|---|---|---|---|
| Very tight | Under 150 | Under 14 | Minimal private space, storage pressure | Temporary stays, dorm-style rooms, ultra-micro units |
| Compact | 150 to 249 | 14 to 23 | Efficient but sensitive to clutter | Studios, shared apartments, tiny homes |
| Moderate | 250 to 399 | 23 to 37 | Functional everyday living | Apartments, condos, small family homes |
| Comfortable | 400 to 649 | 37 to 60 | Room for hobbies, work, and separation | Remote-work homes, suburban houses |
| Spacious | 650 or more | 60 or more | Generous flexibility and privacy | Low-occupancy homes, accessible layouts |
👥Household Comparison Grid
| Scenario | Gross area | Residents | Bedrooms | Usable share | Usable/person | Density read |
|---|---|---|---|---|---|---|
| Urban micro studio | 310 sq ft | 1 | 0 | 79% | 245 sq ft | Compact |
| Solo one-bedroom | 700 sq ft | 1 | 1 | 74% | 518 sq ft | Comfortable |
| Two roommates | 950 sq ft | 2 | 2 | 73% | 347 sq ft | Moderate |
| Family condo | 1,200 sq ft | 4 | 3 | 75% | 225 sq ft | Compact |
| Suburban house | 2,200 sq ft | 4 | 4 | 67% | 369 sq ft | Moderate |
| Multigen townhouse | 1,800 sq ft | 6 | 4 | 69% | 207 sq ft | Compact |
| Student suite | 1,100 sq ft | 5 | 3 | 78% | 172 sq ft | Compact |
| Accessible cottage | 900 sq ft | 1 | 1 | 76% | 684 sq ft | Spacious |
🛏Bedroom Ratio Reference
| Bedroom ratio | Residents per bedroom | Interpretation | Planning signal |
|---|---|---|---|
| Under 0.40 | Over 2.5 | Heavy sharing | Check privacy, sleep schedules, and legal occupancy rules. |
| 0.40 to 0.59 | 1.7 to 2.5 | Shared but workable | Better with large bedrooms and separate study zones. |
| 0.60 to 0.99 | 1.0 to 1.7 | Balanced | Common for families, roommates, and guest-room tradeoffs. |
| 1.00 or more | 1.0 or less | Private-room leaning | Supports remote work, guests, hobbies, or accessible layouts. |
🧮Adjustment And Formula Tables
| Adjustment | Typical range | Use when | Effect on result |
|---|---|---|---|
| Non-living/support area | 3% to 15% | Utility rooms, enclosed storage, unusable lofts, garages | Subtracts directly from gross floor area. |
| Dedicated storage/work area | 0 to 150 sq ft | Home office, gear room, hobby bench, closed-off storage | Removes space that is not flexible shared living area. |
| Circulation/layout loss | 8% to 20% | Hallways, chopped plans, narrow rooms, awkward corners | Subtracts a percentage after support areas are removed. |
| Guest load | 0 to 1 resident | Part-time child, frequent overnight guest, caregiver stay | Raises equivalent resident count for the per-person calculation. |
Adjusted usable area = gross area - support area - dedicated area - circulation/layout loss
Usable area per resident = adjusted usable area / (full-time residents + guest load)
Occupancy target gap = adjusted usable area - (target usable area per resident x equivalent residents)
Bedrooms per resident = bedrooms / equivalent residents
💡Actionable Space Tips
People tend to evaluate homes in terms of their overall size (in square feet), which doesn’t consider actualy usage. A 1,000-square foot condo might feel airy for a single occupant, but it will be airless when shared between three: The distinction isn’t usually the wall; it’s the functionality of space, the percentage that’s usable (for sleeping, working and living) vs. This space is unusable due to wasted hallway space or other structural inefficiencies.
For this reason, we find density per person to be more important than listing price comparisons. Plug in your house’s information into the calculator and suddenly the magic of gross floor area is gone. First it removes the support areas (mechanical room, garage). Then it deducts dedicated non-living areas (hobby bench, home office). Finally, it reduces for circulation loss from awkward corners and skinny hallways which can be significant. A large ranch-style house with the same interior sq ft as a cozy moddern apartment will lose 20% of its footprint to circulation. You rarely live inside these dead-end hallways, yet this hidden portion make all the difference when it comes to comfort.
Why Usable Space Matters More Than Total Size
Then it deducts those figures (the storage), closets, hallways, etc. It divides what’s left (what’s usable) by how many people lives there. That means not just full-time tenants, but also kids, if they’re spending significant time there, or other frequent visitor whose presence adds to the day-to-day volume.
Then take that number and look at where it lands on the spectrum: Is it the layout of a spacious apartment? Or is it a tight micro-unit scenario? Compare it to the usual density breakdowns. Two hundred fifty square feet per person put you in a snug category. It works, but it doesn’t handle messes well. Nudge it toward four hundred square feet and you enter comfort zone. At this size, you can work remotely and have hobbies without always having to negotiate access to common spaces.
Another vital level of context (and one missed by just looking at raw area numbers) is bedroom ratios. You could have a large amount of space across the rest of the house… Kitchen and living room, for example; and still feel cramped if half your family are fighting over two tiny bedrooms. The calculator takes into account how many sleeping rooms there is compared to people. Anything over zero point five per person should keep things private enough for decent sleep. Below that means you’ll probably face heavy sharing arrangements. You would of need scheduling or dedicated study areas to manage them. This tiny metric is a big predictor of home friction.
Use these presets to see how different types of household affect space efficiency. A multigenerational townhouse requires some sort of zoning to accommodate family activities vs. Adult quiet times; on the other hand, a solo telecommuter will want a designated office nook. If you’re often hosting guests, it’s smart to adjust inputs to match too. Even adding half an extra person can change your space from comfortabley to crowded. This means you might need flexible seating or more storage.
In the end, a plan for space isn’t so much about gaining square footage as it’s about guarding the useful minutes in that space. When you carve out that part that truly helps your routine, you’re no longer concerned with theoretical area, instead you begin measuring functional reality, determining when to clear clutter, when to rearrange things and when to pack up and go somewhere else. Because this clears up your vision, you can judge a house by what it will contain (comfort) rather than simply its dimensions (the box itself).