Life Expectancy Calculator
Estimate your total life expectancy, years remaining, projected year reached, and life progress using an actuarial baseline table by age and sex, adjusted for smoking, exercise, weight, diet, alcohol, family longevity, and stress.
🎯Real Lifestyle Presets
📝Your Profile
Whole years from 0 to 109.
🔢Method Snapshot
📊Baseline Life Expectancy By Age
| Current Age | Male: More Years | Male: Total Age | Female: More Years | Female: Total Age |
|---|---|---|---|---|
| Enter your details above to highlight your age band. | ||||
Actuarial style figures rounded for illustration. Total age equals current age plus remaining years. Your matched or interpolated row is highlighted after calculating.
⚖Lifestyle Factor Impact
| Factor | Your Selection | Year Impact | Direction |
|---|---|---|---|
| Your selected factors and their year impacts appear here. | |||
Positive values add years, negative values subtract. The total of these values is your lifestyle adjustment.
🏆Longevity Milestones And Percentiles
| Milestone | Approx Age | Rough Share Reaching | What It Signals |
|---|---|---|---|
| Reach retirement | 65 | About 8 in 10 | Most adults reach this stage |
| Beat average | 78 to 80 | About half | Near the median lifespan |
| Upper quartile | 85 | About 1 in 4 | Longer than most peers |
| Ninetieth | 90 | About 1 in 8 | Notably long life |
| Rare longevity | 95 | About 1 in 25 | Strong genes and habits |
| Centenarian | 100 | Under 1 in 50 | Exceptional outcome |
🗓Life Stage Reference
| Life Stage | Age Range | Health Focus | Longevity Lever |
|---|---|---|---|
| Young adult | 18 to 34 | Build habits early | Avoid smoking, stay active |
| Established | 35 to 49 | Watch weight and stress | Diet quality and screening |
| Midlife | 50 to 64 | Manage blood pressure | Exercise, sleep, checkups |
| Early senior | 65 to 74 | Preserve strength | Mobility and social ties |
| Senior | 75 to 84 | Prevent falls | Balance and nutrition |
| Elder | 85 plus | Maintain function | Support and routine care |
🗂Profile Comparison Grid
| Profile | Age / Sex | Smoking | Exercise | Adjustment | Est. Total Age |
|---|---|---|---|---|---|
| Healthy young male | 30 / M | Never | Active | +7 | 84 |
| Healthy young female | 30 / F | Never | Active | +7 | 89 |
| Average midlife | 45 / M | Never | Moderate | +1 | 79 |
| Long-term smoker | 50 / M | Current | Sedentary | -14 | 65 |
| Active senior | 65 / F | Never | Active | +6 | 91 |
| High-risk profile | 55 / M | Current | Sedentary | -18 | 62 |
Illustrative rows. Your own result is computed from the inputs above, not from this grid.
⚙Full Method Breakdown
💡Practical Longevity Tips
By translating an abstract concept, a health habit, into a tangible number of years, the calculator becomes a planning tool. When you purchase a home or start saving for retirement, you know in rough terms what period of time lies ahead; that’s not an exact number, though, but a variable determined by your daily decisions. The tool doesn’t make decisions for you; it only calculates numbers based off your profile so you don’t have to guess how to convert or use specific coefficients.
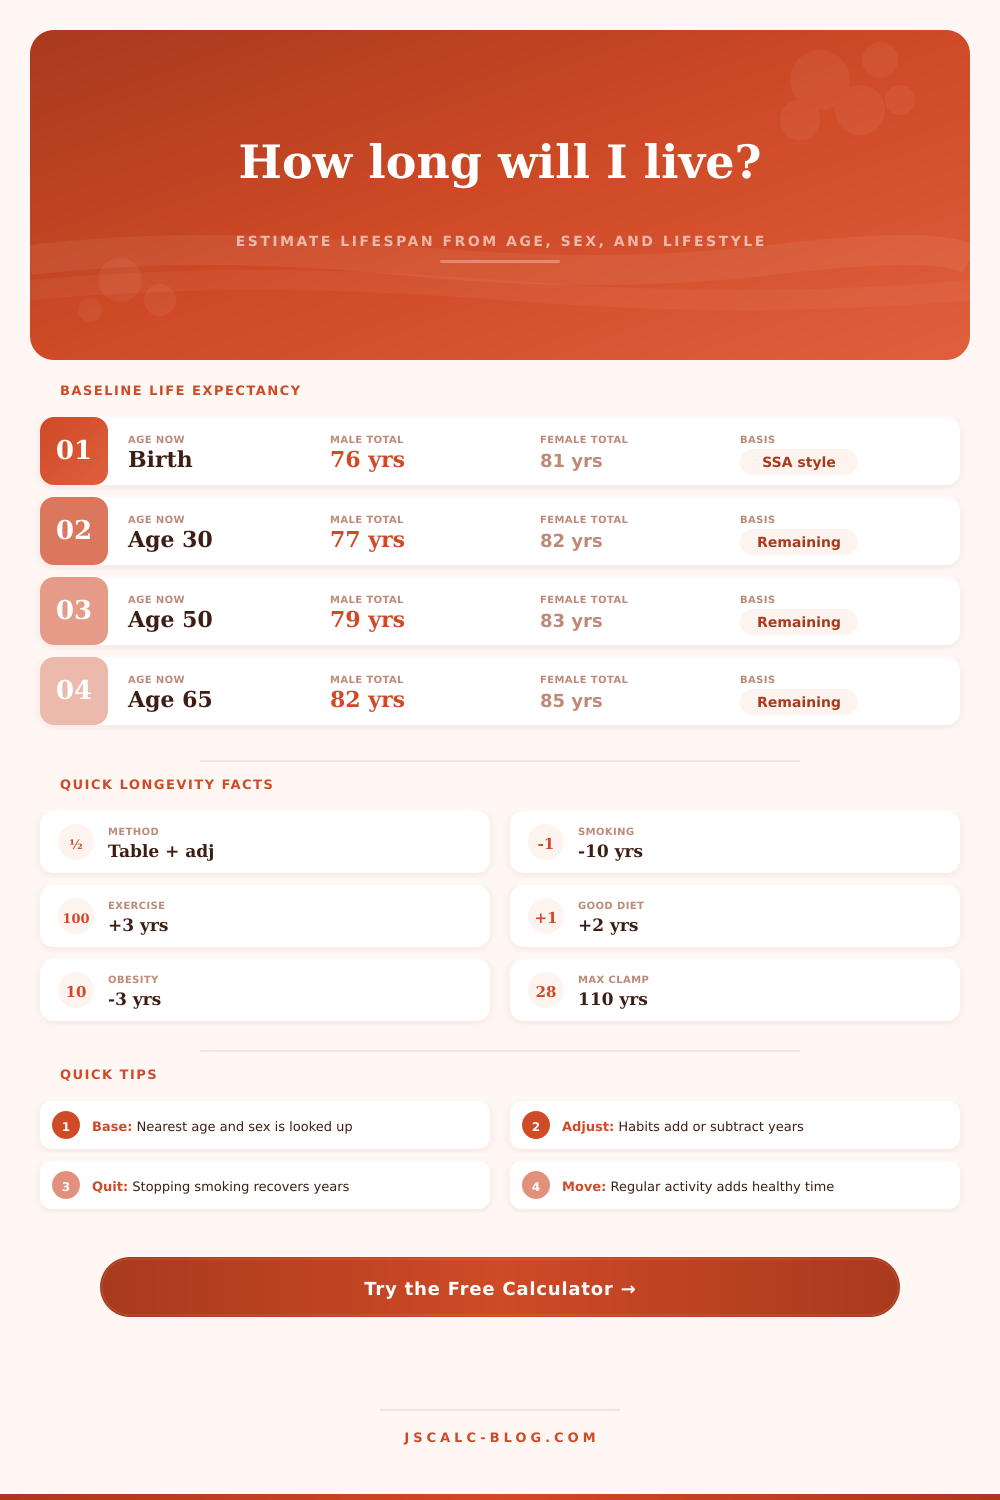
It makes the invisible visible. You begin by entering your gender and age, which generates an actuarial baseline indicating how the majority of you stack up today, statisticaly speaking. You then adjust for lifestyle, and it’s here that data reveals itself, the highest penalty is for smoking. According to this model, never having touched a cigarette will save you about a decade compared to smoking, dwarfing any benefit you might gain from exercising more or eating better. If you are still smoking, quitting is the one thing you could of do that would have the biggest impact. Without judgment, this shows you just how much time you are losing as a result of smoking.
How the Calculator Works
Diet and exercise aren’t primary drivers. However, they is important when used together. A healthy diet adds two years, and regular exercise can adds another three. Individually those don’t sound like much (“I’ll take the two”); but it compounds: That’s what makes the difference between having to deal with age-related problems all the time, or being able to function well into your eighties. It also suggests that you’re not only struggling against march of time, but actualy building up precious stores of healthful time by making good decisions day after day. The calculator reflects this by treating them as additive adjustments to your baseline.
There are quieter pressures, like weight and sleep; which many forget about when pursuing flashier changes to their lifestyle. Obesity can takes away the same number of years that a good diet gives you. It is also a drag on your system that makes it difficult to keep up with any other healthy habit. Poor sleep quality will add stress markers that age your cells faster, whereas getting seven to eight hours of quality sleep promotes recovery. People tend to neglect sleep as a lever until it finally breaks them, so the tool accounts for this by updating your estimate according to how well you sleeps.
The more difficult-to-control variables is family history and stress. You might not be able to pick your relatives or control all your life’s stressful events, but you can still impact how much your genes show: The calculator factors in whether your loved ones had long lives (acknowledging that genetics loads the gun, while lifestyle pulls the trigger). It deducts years for high stress without social support. This is because excess cortisol exposure damage cardiovascular health over time. It affects not just your mood, but also causes physical wear-and-tear.
These four metrics are displayed as your life progress percentage, the calendar year that you may arrive in, the number of years left and your total estimated age. The “may arrive” metric can be shocking; if you see an arrival date of 2085, you are looking at a different world then the one you were born into. That helps put things in perspective (and is good material for both personal goal-setting and financial planning). Why? It makes you consider sustainability rather than mere survival.
These numbers are also probabilistic. They’re not predictions; people tend to treat them like they is, and desire certainty where there is none. It’s a snapshot of where the present moment leads, given what we know today. It does not account for medical breakouts or sudden changes that can flip everything upside down. Think of this like a compass, not a map. It’s pointing you in the direction that your habits will take you. If you see a lower number, you have time to steers course.
In the end, it’s not just a single cure-all; it’s the little things you do every day. That’s where this tool comes in, helping you see how these little thing accumulate into decades (forty or fifty years!). Twenty extra minutes a day of walking could result in a difference of several months at the end of life. Sounds modest. Think about what those moments would be: free time, doing the things you love, and being with people you care for.
Each year matters. Make it count.