Levene Test Calculator
Test whether independent groups have equal variances. Paste raw observations by group, choose the center for absolute deviations, then review the standard Levene or Brown-Forsythe F statistic, right-tail p-value, diagnostics, and group contribution table.
🎯Variance Test Presets
🧮Group Observation Inputs
Use one group per line. A colon, comma, tab, semicolon, or vertical bar can separate the label from the values.
z_ij = absolute distance from the selected within-group center.
Used only when trimmed mean center is selected.
The decision card compares the right-tail p-value with alpha.
Use more decimals for close p-values or report tables.
Sorting changes display only, not the F statistic.
Lenient mode ignores nonnumeric notes after a group label.
This quick screen is separate from the formal Levene F test.
🔢Current Test Snapshot
📋Group Deviation Table
| Group | n | Center | Original mean | Original variance | Mean z | SS between part | SS within part |
|---|---|---|---|---|---|---|---|
| Results load when the calculator runs. | |||||||
📘Method Reference
| Center option | Common name | Center calculation | Best when | Caution |
|---|---|---|---|---|
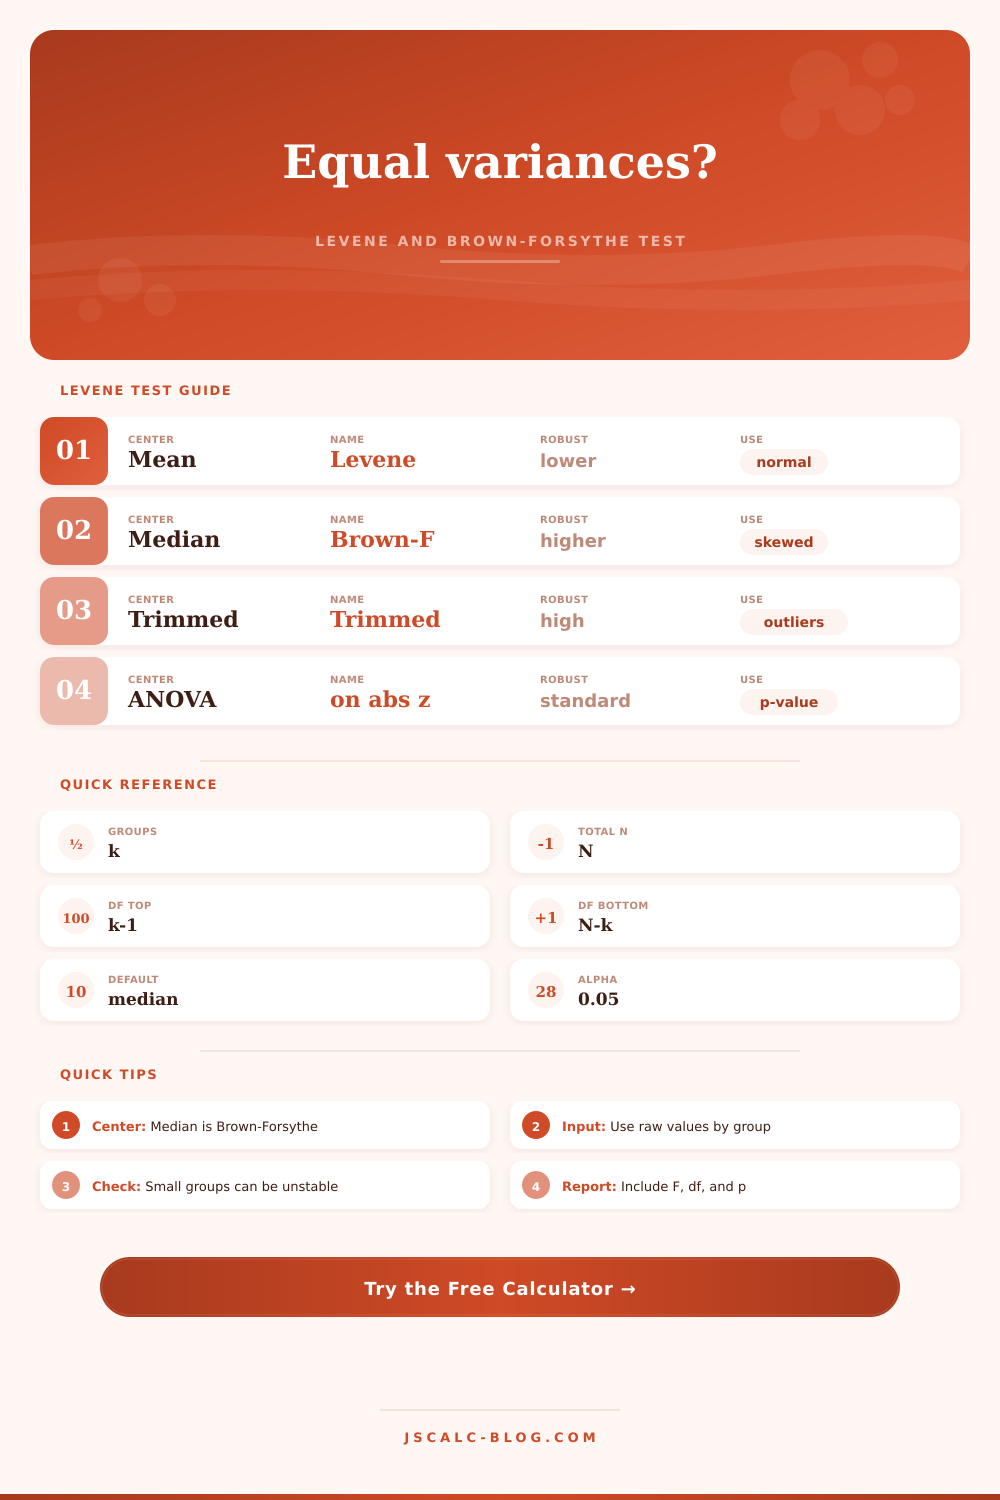
| Mean | Classic Levene | Arithmetic mean within each group | Distributions are roughly symmetric and outliers are not dominant | Less robust when a few extreme observations drive the mean |
| Median | Brown-Forsythe | Median within each group | Data are skewed, heavy-tailed, or have possible outliers | Can be a little less powerful when data are perfectly normal |
| Trimmed mean | Trimmed Levene | Mean after dropping the selected tail percentage | Moderate outliers exist but you still want a mean-like center | Very small groups may trim few or no observations |
| ANOVA on z | Shared final step | z_ij = abs(y_ij - center_i), then one-way ANOVA on z | All Levene-family center choices | Groups should be independent observations |
🧪Preset Comparison Grid
| Preset | Groups | Total n | Measurement | Variance pattern | Suggested center | Typical reading |
|---|---|---|---|---|---|---|
| Classroom Quizzes | 3 | 30 | Scores | One wider section | Median | Moderate spread difference |
| Production Lines | 4 | 48 | Cycle seconds | Line 4 unstable | Median | Strong variance concern |
| Clinical Sites | 4 | 44 | Change score | Site D scattered | Median | Site-level heterogeneity |
| Sensor Noise | 5 | 50 | Reading error | Sensor E noisy | Mean | Calibration check |
| Page Latency | 4 | 52 | Milliseconds | Skew and outliers | Median | Brown-Forsythe preferred |
| Crop Yield Blocks | 4 | 40 | kg plot yield | Mostly similar spread | Mean | Variance assumption likely ok |
| Instrument Repeatability | 3 | 36 | Lab units | Instrument C wide | Median | Precision audit flag |
| Support Queue Times | 4 | 48 | Minutes | Weekend wider | Trimmed | Tail-sensitive workflow |
| Fill Weight Audit | 5 | 50 | Package grams | Shift 3 wider | Median | Manufacturing spread check |
📐Formula Breakdown
💡Practical Levene Test Tips
First, you check if your variances are equal (unequal spread invalidates the math), and then you perform an analysis of variance to see if your treatments differ. That’s what this does: serves as a gatekeeper. You might take this check for granted until it is the only thing that matters.
Before trusting your main results, the Levene test asks: do they all pass assumption of equal variance? Does noise level hold steady across conditions? A lot of folks view it as a formality, but it’s a diagnostic of stability. If spread of your groups are wildly different, the standard F test for means will be unreliable. Depending on your sample sizes, it’ll either inflate false positives or hide real ones.
Why You Should Check Your Variances First
Did the noise level hold steady across your conditions? Enter your data (grouped), select a center, and let it run the math for you in the calculator above. It take raw scores, turns them into absolute deviations, then looks at how much those deviations vary. If your variances is significantly different, it’ll return an F statistic with a p-value to prove it. This is an elegant way to separate location from spread. Traditional variance tests can be confounded by differences in means. Levene’s method doesn’t care where the center of any given group happen to be along the number line. It cares about how far each point are from its respective center.
Now, center choice (where you anchor the group). There’s more here than meets eye. Brown-Forsythe is default median variant. It’s strong against skewed distributions and outliers. When your data isn’t bell-curve shaped but long-tail instead, the mean gets pulled towards the tail. That skews the deviation calculation. Median doesn’t move. It anchors the group, not letting outliers drag it down.
Classic Levene test with mean is great if your data is symmetric and relatively clean. It has a bit more statistical power. A trimmed mean center remove the most extreme values before calculating the result. Middle-ground between a mean and throwing out baby with the bathwater: it protects against skew without discarding average entirely. It is for moderately-outlier data.
It’s not just a p-value, though, that you want. You also want to know where the problem lie. To help with this, the tool shows how much each group contribute to the between-group sum of squares. That way you can see exactly which group is contributing the variance difference. Is it an erratic sensor or one unstable production line? If so, you know where in the process to fix things instead of simply ignoring the statistical test because it violates its assumptions.
When there’s a statistically significant result, then you’ve got a case of violating homogeneity assumption. What happens next is typically switching to a Welch ANOVA if possible or to some kind of nonparametric alternative (such as Kruskal-Wallis). These will be able to cope well with different variances.
The interfaces comes with many of their own presets, which are meant to mirror typical use cases. These range from classroom quizzes to manufacturing audits. Each demonstrates the difference context makes on the variation profile. When variance suddenly spikes up in manufacturing, it can point to a new operator or machine drift. In a clinical trial, it may flag out differences among patients at a certain site. Understanding what the numbers mean requires understanding those types of patterns.
A small p-value isn’t a failure of your experiment. It’s a sign that underlying data structure is more complex than the standard model accounts for. It’s an invitation to look closer at how it works. This takes more time and people tend to skip it.
The cost of checking, however, exceeds the cost of skipping. If you ignore differences, you may draw wrong conclusions about effect of treatment, undermining the whole study. Running the Levene test is cheap insurance against making an error in statistics. It doesn’t tell you whether your means differ or not. It tells you whether it’s even possible for them to be different with ordinary methods.
Look at the variance ratio screen when you run the test. Is the largest variance four times larger than the smallest? That’s a red flag even if p-value isn’t. This is especially true if you have small samples, in which case the test won’t have much power anyway.
In short: good statistics are about reading between the lines of your data. It is about interpreting what it says about the world. It is not so much about what your software tells you about the numbers. The Levene test makes you go look at the spread. You look into the mess. You look at the noise. That is where truth is.
If you’ve checked the variances up front, then whatever signal you eventually detect will be real. It won’t be some artifact of imprecise measurement. It’s a small thing, but it matters. You lay down a foundation for building conclusions, one that they’ll stand upon. You examine ground before you begin digging.