Kendall Tau Calculator
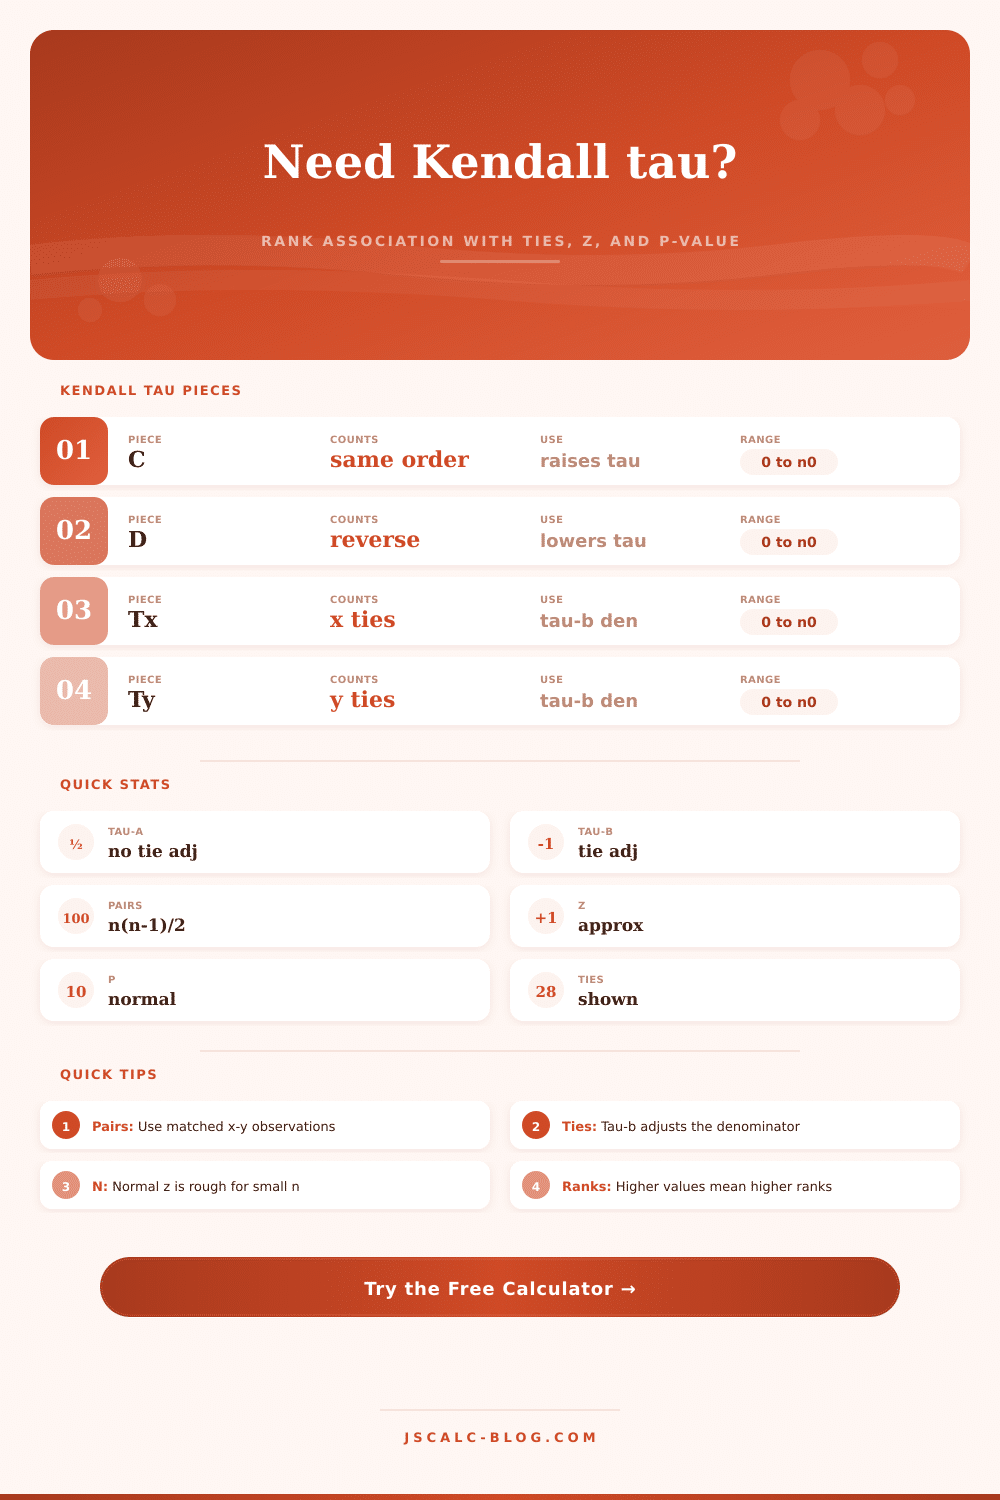
Measure ordinal association from paired values with tau-a, tie-adjusted tau-b, concordant pairs, discordant pairs, tie counts, and an approximate normal z test.
📌Presets
Load a realistic paired ranking example, then edit the values to match your study or audit.
🔢Inputs
Enter ranks, scores, or ordered numeric values separated by commas, spaces, or line breaks.
Values are matched by position: the first X value pairs with the first Y value, and so on.
📈Results
🧮Pair Count Grid
🔍Pair Audit Table
The calculator classifies each pair of observations as concordant, discordant, tied on X, tied on Y, or tied on both variables.
| Pair | X values | Y values | Sign dx | Sign dy | Classification |
|---|---|---|---|---|---|
| Results load when the calculator runs. | |||||
📚Reference Tables
| Tau size | Association wording | What it means | Report with |
|---|---|---|---|
| 0.00 to 0.10 | Very weak | Pair ordering is close to random | C, D, ties, n |
| 0.10 to 0.30 | Weak | Some consistent ordering appears | Tau-b and p |
| 0.30 to 0.50 | Moderate | Many pairs move in the same direction | Tie counts |
| 0.50 to 0.70 | Strong | Rank agreement is clear | Sample size |
| 0.70 to 1.00 | Very strong | Most pairs preserve order | Context notes |
| Output | Formula | Use when | Tie behavior |
|---|---|---|---|
| Tau-a | (C - D) / n0 | There are no ties or ties are rare | Does not adjust |
| Tau-b | (C - D) / sqrt((C + D + Tx)(C + D + Ty)) | Ranks, scores, or scales include ties | Adjusts denominator |
| Approx z | tau / SE | Screening larger samples | Rough with many ties |
| Pair counts | All i < j comparisons | Auditing the statistic | Shows tie sources |
📐Formulas
💡Tips
Kendall tau measures agreement between two individuals when they are asked to rank-order a collection of items. For example, it could be job candidates or wine varieties, where one person likes bold flavors and another prefers subtle notes. Some choices they’ll agree on; others, they won’t. Even though they may get different numbers for any given item, Kendall tau tells you whether their rankings tend to go in the same direction. That’s important because raw scores can confuse us. Two graders may rate on different scales yet intuitively feel that they’re rating similarly high- or low-quality items.
The calculator above does math for you as soon as you enter your paired observations, no need to count all those comparisons by hand. The core idea relies on pairs. The concept relies on pairs. For each observation, find all possible pairs. Then see how the relative order holds up for the two variables. Are A and B judged higher versus lower? That’s a concordant pair. Is one ranked higher and the other lower? That’s discordant.
What Is Kendall Tau?
Basically, the stat is (concordants, discords) / (total pairs). So it’s a straight ratio: probability of agreement minus probability of disagreement. The outcome runs from -1 to +1. Perfect agreement gives a score around one. Random chance give a value near zero. An inverse relationship. One judge’s top choice is the other’s bottom, scores negative.
When we start getting into ties, things get more complex. Ties occur often in real world data since multiple items might receive same score from a judge. Ignoring ties in denominator (as in basic tau-a version) can result in underestimating strength of association when ties are relatively common. To adjust for this, the tie-adjusted tau-b version modifies the denominator to consider observations that were tied on at least one variable. This not only adjusts the statistic up toward its valid range but also makes for a fairer comparison. Given that most practical applications will have many identical values somewhere in their data, tau-b is safer bet.
How big is big? That’s kind of the tricky part. What makes “strong” isn’t something that has a well defined value. In physics, maybe you want 0.9 or higher before saying it means anything. But if you’re studying humans who do all sorts of weird things, 0.3 could be significant in social sciences. You’ll have to judge based off how noisy your particular domain of study is. The page includes a reference table for general guidance, but keep in mind there will always be noise.
Then there’s sample size. If you don’t have many points, even if they agree perfectly, the results might not be statistically significant. This is because you don’t have enough pair to determine that there’s a pattern there. The tool can give you a rough idea through its p-value and approximate z-score. Those are only good for large sample.
People make common errors when they think of the stat as measuring linear correlation. This is wrong because Kendall tau doesn’t assume that judges gives similar numbers. One may be extremely generous while another is harsh but that doesn’t matter. Tau is resistant to outliers and does not assume a specific distribution. What matters is the rank order, and that is what tau measures. (If your data is ordinal then distance between ranks isn’t important.) Many times when ranking systems are compared; say in a competition, or by a search engine, tau will be a better choice than Pearson correlation. You don’t want to know how far apart the scores differ; you just want to know their order.
The second trap is misunderstanding the p-value. When we say “the p-value is small,” what do we mean? Well, this means that if the null hypothesis were true, then there’s a low probability that we’d see an association that we’ve actualy seen. That doesn’t mean anything about the strength of the association, though. If you’re working with a really tiny sample, then you could have a very strong association and still not have statistical significance. And if you’re working with a massive sample, you might have a really weak association but still end up with high statistical significance. To evaluate its practical importance, always eyeball the actual tau value. Strength isn’t everything; so is direction, because a negative zero point eight (tau) is just as strong as a positive one, only in the other direction.
To use the tool well, you have to know what’s going on with your data. For example, if you’re pairing observations (like with lists), make sure they line up: that the first item in list A corresponds to the first item in list B. If you don’t pair them together, for instance by sorting one and not the other, then you’ve destroyed the pairing and nothing meaningful will come of it. It is a small point that makes a big difference.
The calculator has some presets which illustrate common scenarios such as clinical scales or grader agreement. These will give you an idea of how the input translates into output; and also show how ties play out in the equation.
In the end, then, Kendall tau shows consistency. It takes out all the noise about what score means what, and allows you to look only at who’s in what order. Want to check interrater reliability? Validating a new algorithm? Kendall tau provides a strong signal. No need for interval data, no need for normal distributions, all you want are ranks. And if you get ties? The adjusted version holds you accountable. It is a robust measure in a messy world.