Bonferroni Correction Calculator
Adjust a family-wise alpha, correct a raw p-value, compare the Sidak threshold, and estimate the family-wise error rate from any per-comparison alpha.
🧪Multiple-Testing Presets
🔢Correction Inputs
Use the setting to label the breakdown and reporting notes.
The total false-positive rate you want across the family.
Count planned hypotheses in the same claim family.
Enter one unadjusted p-value; repeat for others as needed.
Shows FWER if every test is judged at this single-test alpha.
Bonferroni is conservative; Sidak assumes independent tests.
Role changes interpretation wording, not the correction math.
Use more decimals when m is large or thresholds are tiny.
🧭Current Correction Grid
📐Formula Breakdown
📋Preset Scenario Comparison
| Scenario | m | Family Alpha | Raw p | Bonf Alpha | Adj p | Sidak Alpha | Typical Read |
|---|---|---|---|---|---|---|---|
| Clinical biomarker panel | 12 | 0.05 | 0.0038 | 0.004167 | 0.0456 | 0.004265 | Just passes Bonferroni at 5% |
| A/B metrics dashboard | 8 | 0.05 | 0.0120 | 0.006250 | 0.0960 | 0.006391 | Raw signal does not survive |
| Neuroimaging ROI set | 64 | 0.05 | 0.00090 | 0.000781 | 0.0576 | 0.000801 | Close but above corrected threshold |
| Candidate SNP screen | 500 | 0.05 | 0.00012 | 0.000100 | 0.0600 | 0.000103 | Suggestive candidate signal |
| RNA pathway sweep | 1200 | 0.05 | 0.000030 | 0.0000417 | 0.0360 | 0.0000427 | Passes a strict family correction |
| Education item audit | 24 | 0.10 | 0.0060 | 0.004167 | 0.1440 | 0.004386 | Exploratory flag only |
| Sensor fault bank | 40 | 0.01 | 0.00031 | 0.000250 | 0.0124 | 0.000251 | Misses a 1% family rule |
| Ecology species contrasts | 18 | 0.05 | 0.0041 | 0.002778 | 0.0738 | 0.002845 | Report as uncorrected evidence |
| Marketing segment slices | 30 | 0.05 | 0.0019 | 0.001667 | 0.0570 | 0.001708 | Near miss after correction |
⚖Bonferroni vs Sidak Reference
| Method | Threshold Formula | Assumption | Conservatism | When To Prefer |
|---|---|---|---|---|
| Bonferroni alpha | α / m | No independence required | Often conservative | Default simple family control |
| Bonferroni p-value | min(p x m, 1) | Same as Bonferroni alpha | Often conservative | Reporting corrected p-values |
| Sidak alpha | 1 - (1 - α)^(1/m) | Independent tests | Slightly less conservative | Independent planned comparisons |
| No correction | α per test | Single isolated test | No family control | Only one primary hypothesis |
| Holm context | Step-down thresholds | Ordered p-values | Less conservative than Bonferroni | Full family p-value lists |
| FDR context | Controls expected false discoveries | Many discoveries expected | Different error goal | Large screening studies |
📈FWER Lookup at Common Per-Test Alpha
| Tests m | FWER at 0.05 | FWER at 0.01 | Bonf Alpha for 0.05 | Sidak Alpha for 0.05 |
|---|---|---|---|---|
| 2 | 9.75% | 1.99% | 0.025000 | 0.025321 |
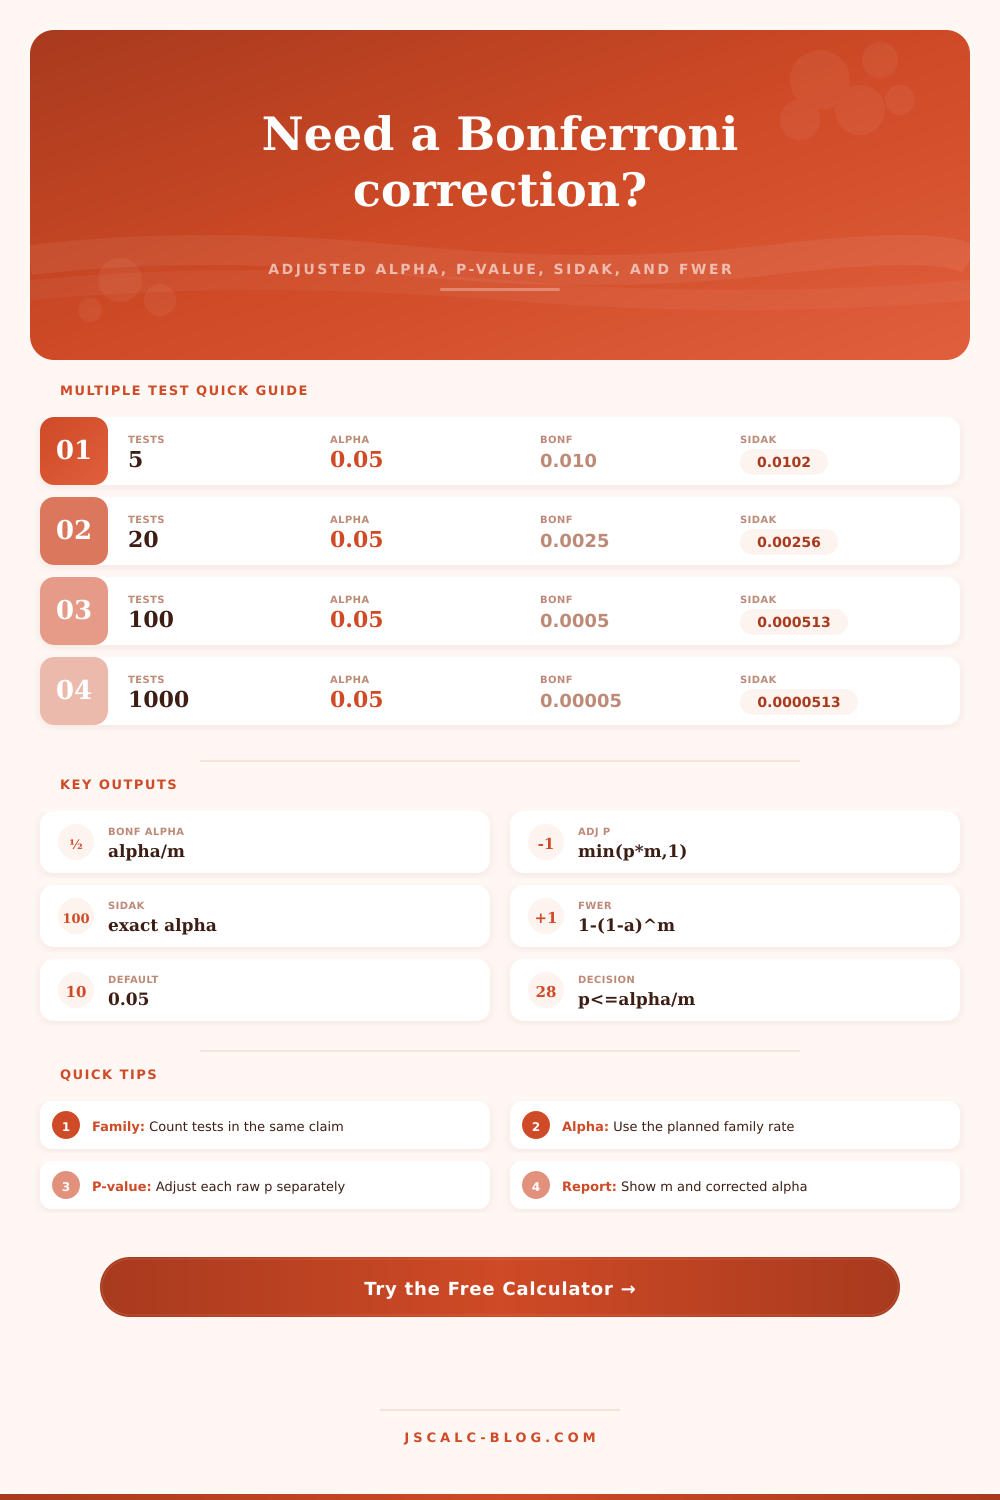
| 5 | 22.62% | 4.90% | 0.010000 | 0.010206 |
| 10 | 40.13% | 9.56% | 0.005000 | 0.005116 |
| 20 | 64.15% | 18.21% | 0.002500 | 0.002561 |
| 50 | 92.31% | 39.50% | 0.001000 | 0.001026 |
| 100 | 99.41% | 63.40% | 0.000500 | 0.000513 |
| 500 | >99.99% | 99.34% | 0.000100 | 0.000103 |
🔍Multiple-Testing Reporting Checks
| Check | Good Practice | Risk Pattern | Why It Matters | Calculator Field |
|---|---|---|---|---|
| Family definition | Tests answer one planned family | Conveniently excluding tests | Changes the correction threshold | Number of tests m |
| Alpha chosen first | Family alpha set before analysis | Alpha moved after seeing p-values | Inflates false-positive claims | Family-wise alpha |
| Raw p precision | Use full unrounded p-value | Only p < 0.05 available | Adjusted p needs numeric detail | Raw p-value |
| Method stated | Name Bonferroni or Sidak | Only says corrected | Readers need the error rule | Decision method |
| FWER context | Show risk from uncorrected alpha | Treating many tests as one test | Explains why correction is needed | Per-comparison alpha |
| Exploratory screen | Label as hypothesis-generating | Claims confirmation from a sweep | Correction does not fix weak design | P-value role |
💡Practical Correction Tips
Let’s say you’re testing a new drug on three symptoms simultanously. You get important results for only one of those three symptom. Hooray! But then you discover later that running all three together raised the chances of getting a false positive by chance from five percent to fifteen percent. That’s the sneaky pitfall of multiple testing.
If you performs multiple statistical tests within a single study, each additional test multiply your chances of being wrong. Use the Bonferroni correction to fix this inflation.
Why Bonferroni Correction Is Important
Enter your exact number of comparisons into the calculator above. It will crunch the numbers and adjust p-values (or alpha level) to match. This helps you know what you can call a finding rather than just noise pretending to be a signal.
Just calculate your desired family-wise error rate (typically five percent), then divide by the number of comparisons you made. So if you did ten comparisons, now your new threshold for statistical significance is half a percent. Why does that feel so harsh? Because that’s its job. It’s being as conservative as possible. So you increase your confidence in your findings, they’re probably not a fluke! But this comes at the cost of losing some ability to pick up on really small, significant effects. That’s what most researchers is reluctant to sign off on. “I just want my data to speak!” but also “and I want to make sure my data isn’t lying to me.”
This little tool on page makes it easier to understand that changing either the raw p-value or alpha threshold will always result in the same decision. Most people trip up on question of what makes a test. Just because it’s obvious doesn’t mean it should of been counted. Ten biomarker measurements? That’s 10 tests. Now separate each one into genders? You’ve just doubled your family size there. The calculator asks you to specifically define this family. It also provides presets so you can load common study designs, such as A/B testing dashboards and clinical panels. These give the abstract numbers a concrete set of study designs to attach too.
Because the risk of over- (or under-) correcting something based off a small pilot study and doing the same thing with a massive genomic screen is too easy. The penalty for staring harder becomes steeper very quickly, and context matter.
The other thing that’s shown on this calculator (which it compares to the Bonferroni result) is what’s called the Sidak adjustment. It involve a more complicated exponential equation, and it assume that your tests are independent. So in practical terms, the actual numbers you come up with using Bonferroni vs. Sidak will often be pretty similar, particularly if you have only a few test and are doing something like a.05 significance test. But when you’re talking hundreds of variables, even the tiniest mathematical variation in the cutoff might make result go from significant to non-significant. Having both in side-by-side format lets you assess just how vulnerable your results are to the independence assumption.
Last, look at the family-wise error rate output. In this case, it tells you the overall probability that you will make at least one false positive claim without doing any correction. As you keep adding tests, you’ll see the number shoot up from five percent to ninety percent, which can be a sobering reminder about why we’re even doing this in the first place! It makes a concrete risk metric out of something that’s otherwise an abstract statistic. We’re not playing with numbers here: we’re quantifying the likelihood of being wrong.
Whether you’re creating a business report or peer-reviewed paper, the calculator gives you exactness required for accurate reporting. It removes the guessing game from comparing many thing at once. But finally, all of this gets back to how much care is in the discipline to use such a thing rather than in the formula itself. Do you define your hypotheses prior to seeing the data? Are all the comparisons that inform your ultimate conclusions counted? And are you willing to throw away an interesting lead when the numbers prove it wrong? If so, great, but a wrong answer is worse then none at all. The math shields you from yourself, from your optimism.