Kurtosis Calculator
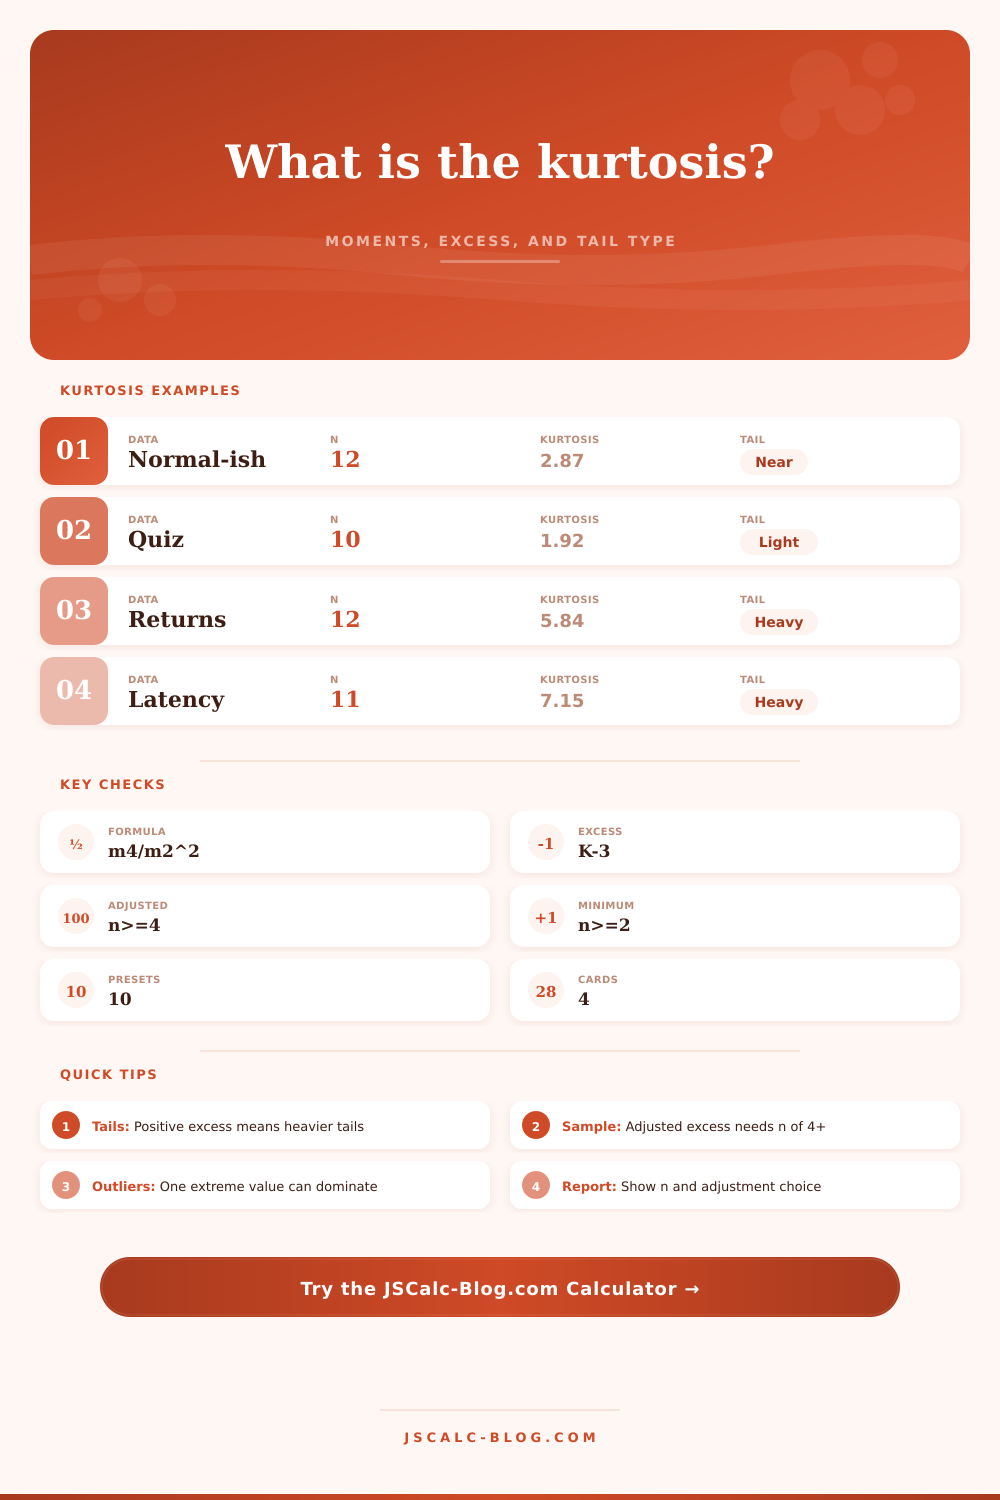
Paste numeric data into the JSCalc-Blog.com tool to compute moment kurtosis = m4/m2^2, excess kurtosis = kurtosis - 3, optional sample-adjusted excess kurtosis, and a practical tail classification.
📌Data Presets
Load a realistic dataset, then adjust the method, parsing, rounding, label, and unit before calculating.
🔢Dataset Inputs
Calculation Breakdown
🧮Kurtosis Method Cards
🗂Tail Classification Grid
📋Reference Tables
| Measure | Formula | Minimum n | Reports | Use when |
|---|---|---|---|---|
| Moment kurtosis | m4 / m2^2 | 2 distinct | Kurtosis around normal value 3 | You want the direct fourth-to-second moment ratio. |
| Moment excess | K - 3 | 2 distinct | Normal reference around zero | You want an easy light-tail or heavy-tail sign. |
| Sample-adjusted excess | ((n-1)/((n-2)(n-3)))((n+1)g2+6) | 4 | Adjusted G2 excess | You are summarizing a sample rather than a complete population. |
| Second central moment | sum((x-mean)^2) / n | 2 | Scale of squared spread | You need the denominator used inside kurtosis. |
| Fourth central moment | sum((x-mean)^4) / n | 2 | Tail-weight numerator | You need to see how extremes affect the statistic. |
| Contribution share | d^4 / sum(d^4) | 2 | Extreme-value influence | You want to know which observations drive kurtosis. |
| Data context | Common tail pattern | Watch for | Useful companion | Reporting note |
|---|---|---|---|---|
| Exam scores | Light or bounded tails | Ceiling and floor effects | Mean, SD, skewness | Mention the score range if bounded. |
| Financial returns | Heavy tails | Shock days and sign changes | Percentiles, drawdown | Use excess kurtosis with n. |
| Server latency | Heavy right tail | Timeouts and retries | p95 and p99 | Sort high contributors. |
| Lab precision | Near normal or light | Instrument resolution | Coefficient of variation | Use enough decimals. |
| Survey ratings | Bounded light tails | Ordinal scale limits | Median, IQR | Do not overstate tails on short scales. |
| Process counts | Mixed, often heavy | Batch changes or mixed groups | Control chart | Segment before interpreting if needed. |
| Observation | Deviation | Deviation^2 | Deviation^4 | m4 share |
|---|---|---|---|---|
| Calculate | to | refresh | the | contributors |
💡Kurtosis Tips
If you’ve been around finance long enough, you’ll probably recall that your data should be “well behaved” according to the Bell Curve. But that’s not true; most real data doesn’t resemble it. When you try to build a risk model, the data spike, flattens, and throws outliers at you. Those are represented by kurtosis, the measure of the tails, something that’s ignored by standard deviation.
Does your data hover closely near the mean? Or does it experience extreme shocks? Because what happens in the tails can be catastrophic. Your average variance mask them, and you need the difference. This is where this tool comes into play: the calculator on this page will do the math for you. It turns a jumble of numbers into a sharp illustration of tail risk, enabling you to determine if your model is safe.
What is Kurtosis and Why It Matters
I won’t go into the math, but those equations are intimidating while the underlying idea isn’t. Kurtosis divide the fourth central moment by (the square of) the second central moment. What do those moments mean? The second moment (variance) is the average squared distance from the mean. The fourth moment is that same distance raised to the fourth power. Here’s the important part: That exponent matter. Raising something to the second power makes big values bigger, but raising them to the fourth power makes massive values really frickin’ big. One outlier doesn’t slightly alter things; it takes over entire equation.
Why is kurtosis so touchy? Because it flags extremes. It forces you to pay attention to the edges of the data distribution instead of its middle. People naturaly think the number represents peak height. Nope. It’s about the tails. The peak is an afterthought.
Excess kurtosis tell you how different your data is from a normal distribution. Normal distributions has kurtosis equal to three. Excess kurtosis centers this around zero by subtracting three. So if you’re positive, it’s got heavy tails. There are more extreme values in your data then a normal bell curve suggests. And if it’s negative, then there are light tails. Your data is more uniform and flat.
The tool will tell you about these tails. It’ll classify them according to standard thresholds: heavy, light, or close to normal. And this classification will help you get a sense of risk quickly. If you’re looking at financial returns, heavy tails would be a warning sign. That means your model think that crashes and windfalls are less likely than they really are. If you’re looking at manufacturing tolerances, then maybe light tails would signal a tightly controlled process. What’s good and what’s bad depends on context.
Keep in mind: These metrics apply to whatever sample size you’re working with. And small sample sizes is noisy. That means the kurtosis number will swing wildly based off just a few points. The calculator has an adjusted excess option that addresses this bias (with as little as four points of data). But it’s a tiny tweak that still keeps small samples from appearing spikily artificially.
Also look at the contribution breakdown. This tells you what particular values is driving up the fourth moment. If half the total fourth moment come from one data point, then your kurtosis number is only reflective of that single outlier. It doesn’t tell you anything about the shape of the rest of the distribution, you should of gone and examine the outlier itself. Is it an error? Or maybe a signal?
The real world is messy. Light tails show up in exam scores (they range from zero to one hundred). Heavy right tails exist when servers get slow. Fat tails appear in financial markets, they occur on both sides of the market. This calculator allows you to select your rounding and also read all kinds of different formats. It doesn’t judge the data; it quantifies the extremes.
You need to understand what those extremes mean for you. High kurtosis isn’t necessarily bad. It’s informative. It says: don’t hide behind the average. Plan for the tails. The tool provides the numbers and you bring the wisdom. That balance makes it useful. You begin with a set of numbers. You end with an understanding of risk. Looking beyond the mean.