Inter-Rater Reliability Calculator
Calculate observed percent agreement, chance-expected agreement, Cohen kappa for two nominal raters, and Fleiss kappa approximation for multiple raters using category-count data.
📌 Reliability Presets
📝 Agreement Inputs
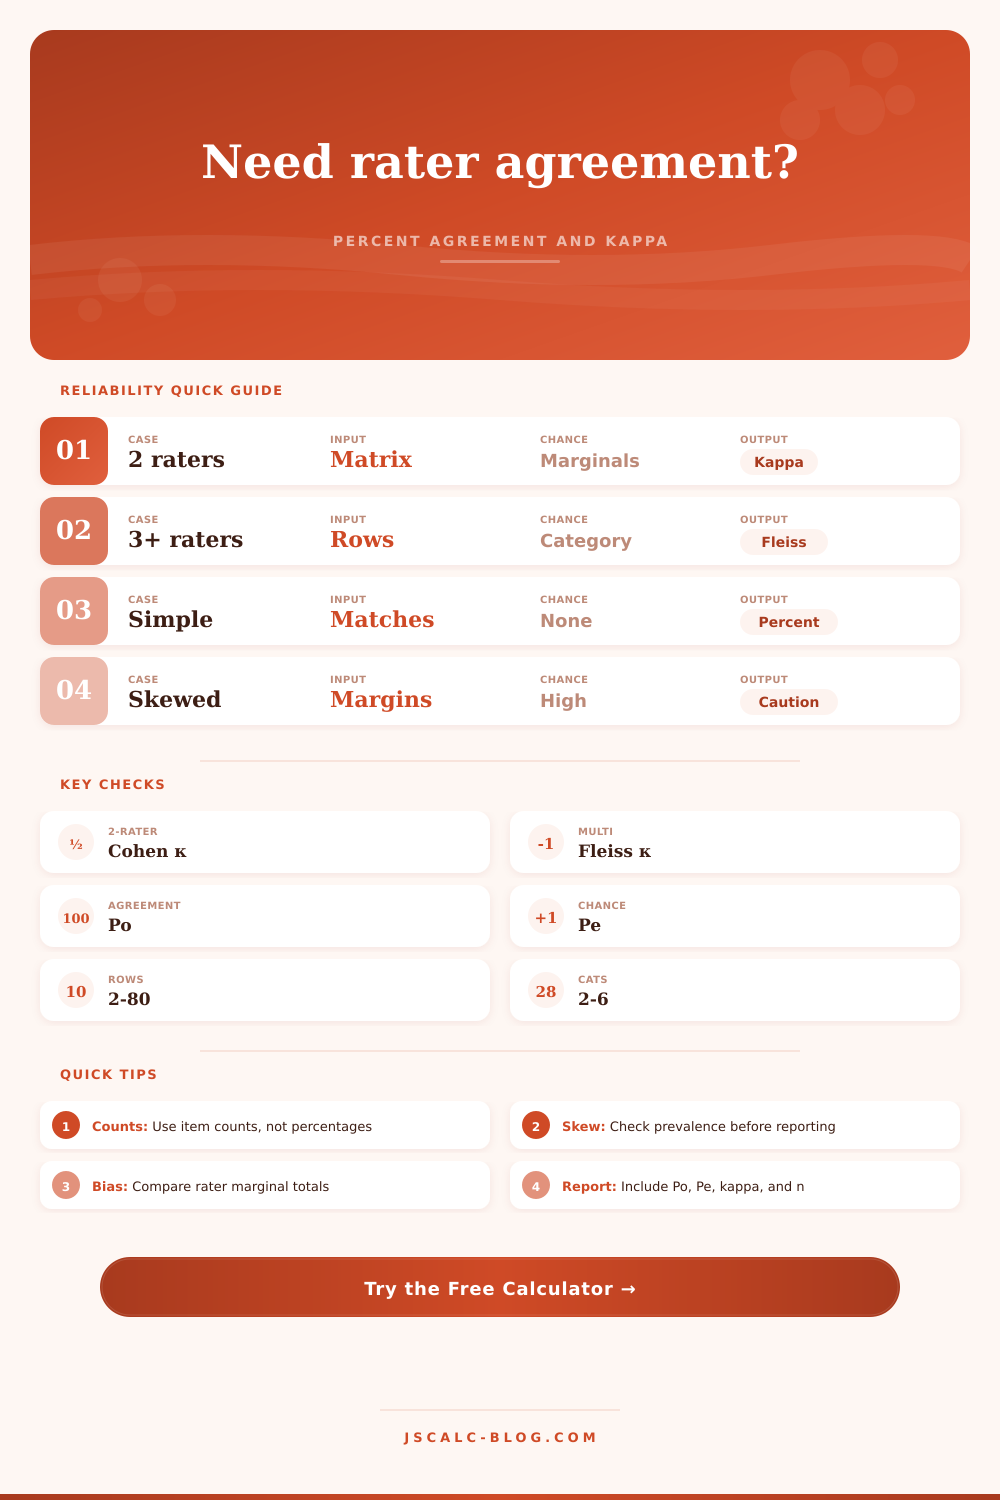
Use Cohen kappa for exactly two nominal raters; use Fleiss when items receive category counts from several raters.
The calculator reads the first 2 to 6 categories from each matrix row.
Optional audit count. Enter 0 to ignore; otherwise it is compared with eligible items or paired ratings.
Percent values use one extra decimal place for easier reporting.
These labels are applied to rows, columns, category summaries, and reporting notes.
Classic Fleiss kappa assumes the same number of raters per item; varying rows are labeled as an approximation.
Rows are Rater A categories, columns are Rater B categories. Use comma, tab, or space separated counts; one row per Rater A category.
Each row is one item; each number is how many raters chose that category. Example for 5 raters and 3 categories: 4,1,0.
🔢 Current Reliability Snapshot
📐 Formula Breakdown
📊 Active Category Summary
For Cohen kappa, row and column percentages describe each rater's marginal category use. For Fleiss kappa, category share describes all ratings pooled across items.
🧮 Active Agreement Details
The detail table changes by method: a confusion matrix for two raters, or per-item pairwise agreement rows for multiple raters.
📋 Method Comparison Table
| Method | Best For | Input Shape | Chance Term | Primary Output | Main Caution |
|---|---|---|---|---|---|
| Percent agreement | Simple quality checks | Matched ratings or item rows | None | Po or Pbar | Can be inflated by easy or skewed categories |
| Cohen kappa | Two nominal raters | Square confusion matrix | Row x column marginals | Kappa | Prevalence and bias can depress or inflate interpretation |
| Fleiss kappa | Three or more raters | Items x category counts | Pooled category proportions | Kappa | Classic form expects fixed rater count per item |
| PABAK | 2 x 2 prevalence checks | Two-rater matrix | Adjusted from Po | 2Po - 1 | Diagnostic supplement, not a replacement report |
| Weighted kappa | Ordinal labels | Ordered square matrix | Weighted marginals | Weighted kappa | This calculator is for nominal unweighted kappa |
| Krippendorff alpha | Missing ratings and mixed raters | Rater-by-item data | Disagreement expected by chance | Alpha | Use a dedicated alpha tool for complex missingness |
📏 Kappa Interpretation Table
| Kappa Range | Band | Plain Reading | Percent Agreement Check | Prevalence Cue | Reporting Reminder |
|---|---|---|---|---|---|
| Below 0.00 | Poor | Worse than chance expectation | Inspect coding rules | May signal reversed labels | Audit the raw matrix first |
| 0.00 to 0.20 | Slight | Small chance-corrected agreement | Po may still look acceptable | High skew can dominate Pe | Report category totals |
| 0.21 to 0.40 | Fair | Limited but visible reliability | Improve definitions | Look for threshold bias | Add training examples |
| 0.41 to 0.60 | Moderate | Useful but not tight agreement | Often enough for screening | Check dominant categories | Report uncertainty if formal |
| 0.61 to 0.80 | Substantial | Strong operational reliability | Confirm across subgroups | Skew still matters | Include n and category labels |
| 0.81 to 1.00 | Almost perfect | Very high chance-corrected agreement | Check for duplicate coding | Rare labels may still be weak | Show confusion or item table |
📈 Preset Data Reference
| Preset | Method | Categories | Items or Pairs | Typical Agreement Pattern | Reliability Risk |
|---|---|---|---|---|---|
| Radiology benign suspicious malignant | Cohen | 3 | 132 | Strong diagonal with mild adjacent drift | Suspicious cases can split thresholds |
| Essay rubric four levels | Fleiss | 4 | 18 | Four teachers cluster near adjacent scores | Ordinal labels are treated as nominal here |
| Support ticket severity | Cohen | 4 | 200 | High agreement on low and critical cases | Medium versus high thresholds drift |
| UX task outcome coding | Cohen | 3 | 96 | Mostly success or assist with some failure splits | Prevalent success can lift Po |
| Emergency triage nurses | Fleiss | 5 | 18 | Four raters per case with moderate spread | Rare immediate cases drive uncertainty |
| Content moderation team | Fleiss | 4 | 20 | Five raters, frequent safe and spam labels | Policy boundary cases affect Pe |
| Classroom behavior observers | Cohen | 3 | 150 | Strong agreement on on-task behavior | Dominant normal behavior can mask misses |
| Pathology grade panel | Fleiss | 4 | 16 | Six raters on grade categories | Adjacent grade disagreements are nominal |
| Sentiment labeling review | Cohen | 3 | 180 | Neutral and mixed language create off-diagonal counts | Class imbalance changes expected agreement |
💡 Reliability Reporting Tips
Two radiologists are asked to look at a chest X-ray. They both looks at it. One spots a shadow that she think looks like cancer. The other radiologist looks at the same image and just detects a nodule which he believe is most likely benign. Who’s right? That’s the question. But first: do they even speak the same language?
Perhaps one has less certainty than the other. Maybe their coding rules aren’t clear. Perhaps there thresholds for uncertainty differ. Perhaps there thresholds for uncertainty differ. Whatever the reason, the fact that two different person interpret the image differently isnt a medical mystery; it’s an issue of measurement. That’s what inter-rater reliability aims to solve.
What Is Inter-Rater Reliability?
Percent agreement makes intuitive sense. Two raters has to agree on 90 out of 100 items, so their score is 90 percent. Sounds great. And it typically is…until you remember that maybe the raters are just being lazy. Maybe they see that 90 percent of the case are obviously benign. They can gets away with agreeing 90 percent of the time by picking the low-hanging fruit every single time. Who cares about the hard stuff?
That’s why we use chance-corrected metrics. They removes the portion of agreement that comes from systemic bias, or random guesswork. What’s left over is signal that shows your coders understand the categories in a similar way.
That’s where our calculator comes in (above). It can handles simple pair checks versus complex multi-rater panels. For the former, you provide it with your confusion matrix for two raters. For the latter, you provide it with counts per category for larger groups. And out pops either Cohen’s kappa or Fleiss’ kappa accordingly.
What’s the difference? It is about structure. Cohen’s kappa is designed to work with precisely two observers. That allows it to assess how much agreement exists between their individual marginals. Fleiss’ kappa generalize this approach for three+ raters. It treats a pool of judges as its unit, not the judge-pairs themselfs. So pick the right one. Don’t force five moderators who labeled your content into a two-rater box. Instead, use the multi-rater approach that models the group dynamic itself.
Prevalence is the other quiet assassin because it affect the reliability scores. The higher prevalence, the greater the chance that annotators will agree by luck. For instance, in a dataset with overwhelmingly safe content, that expected level is sky-high. That squashes the kappa score. People’s good performance look mediocre. It is counterintuitive. So researchers freaks out about their scores.
In fact, those scores are showing that they have good data and little noise. Don’t get hung up on just the number; also examine the breakdown which includes category distribution. An imbalance so extreme can result in a lower kappa even if the coding is rock-solid. It is a little detail, but it is important when interpreting your final report.
The other part of this equation is bias. Maybe Rater A always rates an essay higher, and maybe Rater B is tougher. But if they both agree on what constitutes average, then even though they don’t match up in the margins, there’s nothing wrong with that.
That’s where the marginal totals comes into play. If one rater has a tendency to be too hard (or loose) on ratings, you’ll see that. And that’s more valuable than the kappa number at the end. That tells you how well calibrated your raters are. You can train them on calibration examples to correct for that type of thing. But you can’t do anything about that by changing the formula.
Use reliability as a test of how well you defined things and coded to match. This is NOT a pass/fail test! If agreement is high, it implies that your definitions are unambiguous. If it’s low, your definitions were ambiguous. There are some standard bands provided for interpretation on this page, which can serve as a guideline but not law.
In any real world application, what makes good agreement depends on the context. For example, achieving a modest kappa in a difficult to define, subjective realm such as psychological assessment could of success. But achieving the same result on a simple yes/no task would be a failure. Always remember: context trumps everything.
Bottom line: You’re attempting to create a shared reality from subjective impressions. It is messy stuff. The calculator takes away the math problem. It lets you concentrate on the human aspect of alignment. Your raters get their heads around seeing the world in the same way (and the numbers will reflect it). Until they do, the math is a mirror. It is a reflection of precisely where your definitions breaks down under pressure.