Cronbach Alpha Calculator
Estimate internal consistency from summary reliability statistics or a pasted response matrix. The calculator reports standard Cronbach alpha, standardized alpha from average inter-item correlation, variance components, and item-level diagnostics.
🎯Reliability Presets
🧮Cronbach Alpha Inputs
Summary mode uses variances directly; raw mode computes them from rows of responses.
Interpretation still depends on construct breadth, item wording, and use case.
Use the number of scored items included in the total scale score.
Raw mode replaces this with the number of complete response rows.
Enter one sample variance per item, separated by commas, spaces, or line breaks.
Variance of each respondent's summed scale score.
Used for standardized alpha: k*rbar / (1 + (k - 1)*rbar).
Each row is a respondent; each column is an item. Use raw mode for automatic variance and correlation diagnostics.
📋Reliability Snapshot Grid
🔍Computed Item Diagnostics
Item Variance Table
Reliability Path Table
📘Alpha Interpretation Table
| Alpha Range | Common Reading | What It Suggests | Typical Next Check | Reporting Caution |
|---|---|---|---|---|
| 0.95 and above | Very high | Items may be repetitive or overly narrow | Inspect redundancy and item wording | High alpha does not prove validity |
| 0.90 to 0.949 | Excellent | Strong shared variance across items | Check dimensionality before reporting | May be too high for broad constructs |
| 0.80 to 0.899 | Good | Reliable internal consistency for many uses | Review item-total correlations | Still verify construct coverage |
| 0.70 to 0.799 | Acceptable | Often acceptable for research screening | Inspect weak or reversed items | Context matters more than a fixed cutoff |
| 0.60 to 0.699 | Questionable | Items may be loosely related | Revise, add items, or split dimensions | Explain limits if retained |
| Below 0.60 | Low | Scale is likely unreliable as one score | Check coding, dimensions, and item quality | A single summed score may mislead |
| Negative | Invalid warning | Average covariance may be negative | Check reverse scoring immediately | Do not interpret as reliability |
🗂Preset Reference Table
| Preset | Mode | Items | Respondents | Expected Alpha | Scale Pattern | Best Use |
|---|---|---|---|---|---|---|
| Engagement Scale | Summary | 6 | 42 | Good | Likert, balanced variance | Attitude survey reliability |
| Anxiety Screener | Raw | 7 | 14 | High | Consistent symptom responses | Small clinical pilot check |
| Classroom Rubric | Summary | 5 | 31 | Moderate | Related rating dimensions | Rubric score review |
| UX Satisfaction | Raw | 6 | 15 | Good | Ordinal survey responses | Product feedback battery |
| Safety Climate | Summary | 9 | 118 | Excellent | Large team survey | Organization scale report |
| Knowledge Quiz | Raw | 8 | 16 | Mixed | Binary scored items | Quiz coherence screen |
| Fatigue Index | Summary | 4 | 67 | Acceptable | Short multi-symptom index | Brief scale monitoring |
| Leadership 360 | Raw | 8 | 14 | High | Performance ratings | Rater form consistency |
| Mixed Weak Items | Summary | 6 | 40 | Low | Weak inter-item link | Demonstrate item revision need |
⚙Formula Method Table
💡Reliability Tips
You have six carefully made questions that you distribute to employee in a survey, hoping that you’ll measure their engagement. You tabulate response and calculate a Cronbach alpha of 0.42. Why? Because your scale doesn’t make sense. It’s not measuring one thing; it’s picking up noise instead. Researchers call that an internal consistency issue, and it tells you if you are measuring something real or just measuring nothing at all.
Once you plug in your raw responses or the variance between items, calculator above crunches the numbers for you (and spares you having to guess at coefficients). Cronbach alpha assess how much your questions overlap in what they capture. If you want to measure overall job satisfaction, you should of have questions that move together (people who like their pay, for example, should also likes their team and their boss). It looks at the correlation between every possible combination of two item. If correlations are high, it suggests that the items all tap into same underlying idea. If they are low, it means they is pulling in different directions. And that is where the interpretation comes in, understanding what exactly you are measuring.
What is Cronbach Alpha?
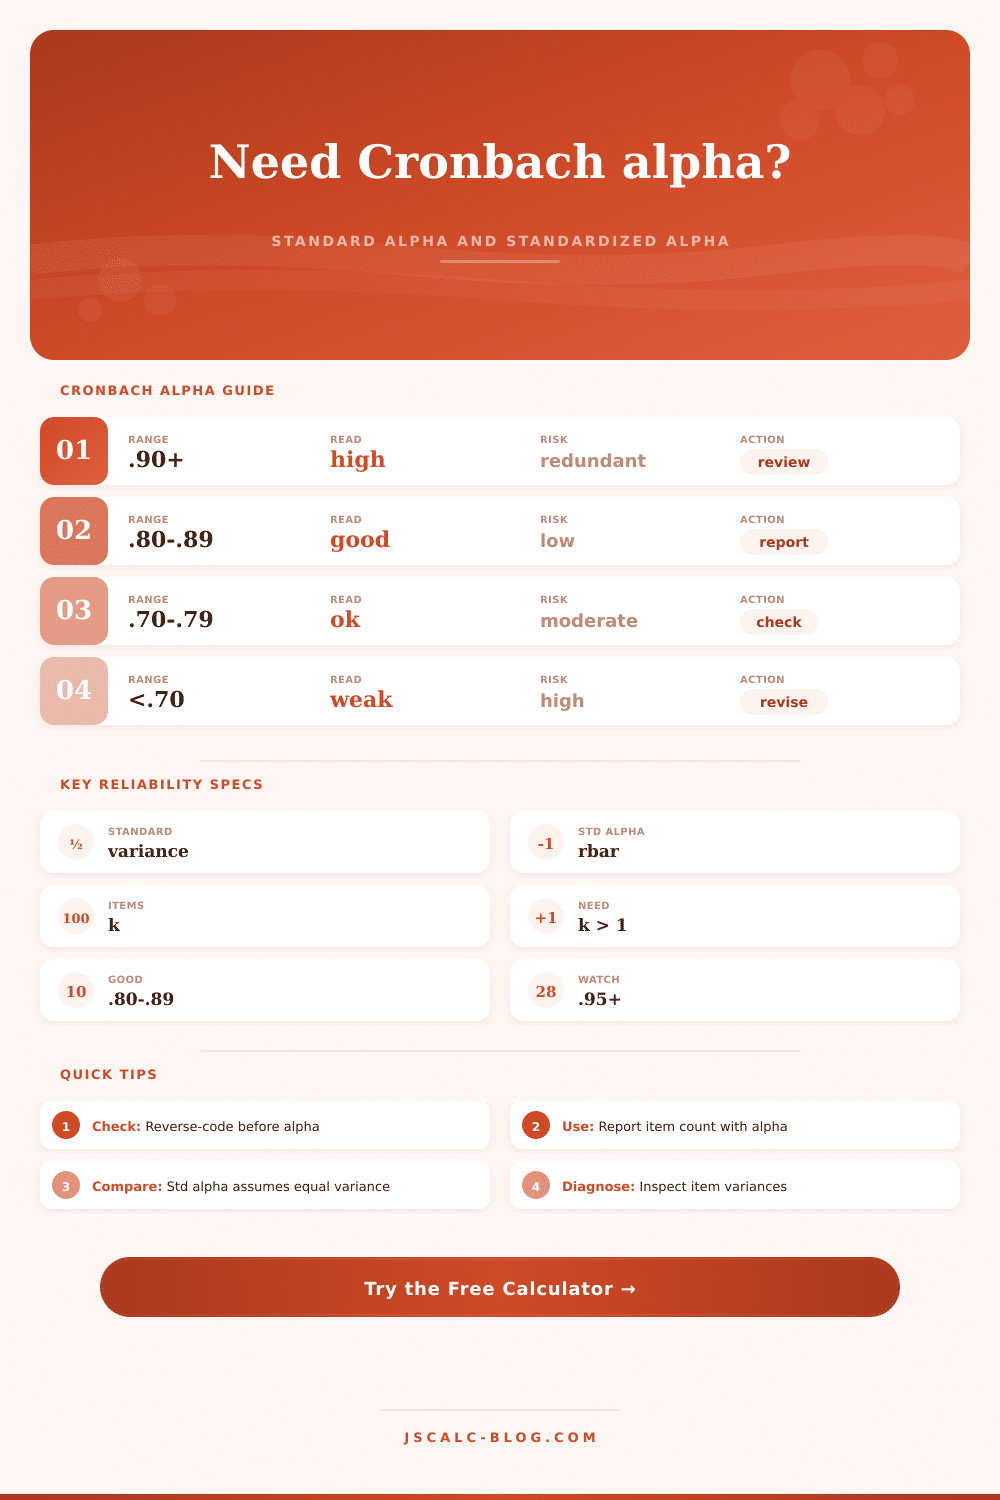
Don’t chase perfection, alpha of 0.95 isn’t ideal. In fact, it’s probably too good. That typically indicates redundancy in your items. Three identical questions on how much you like your job? Very high alpha. But also three wasted survey slots because you’re asking the exact same question. People mess this up: you want enough variety to demonstrate breadth and enough overlap to demonstrate reliability. The typical sweet spot is around 0.70-0.90 (see table of references). Below 0.70, your scale are shaky. Above 0.90, be sure to look out for repetition.
A note about input: How the test was entered makes a difference in diagnostics. Did you obtain variances elsewhere (e.g., from another package)? Enter those summary stats. Did you simply copy/paste the raw response matrix? That’s better when troubleshooting, as the tool can calculates item-total correlations immediately. Raw mode will help you identify which item(s) is dragging down the alpha. Often it’s only one bad question, not whole scale! Drop it and see how much your score jumps up.
Report both the alpha AND the number of items. An alpha of.80 with four items isn’t the same than an alpha of.80 with twenty items.
Reliability scores are highly sensitive to reverse coding. When combining positive and negative statements, one must reverse code the negatives prior to scoring. Otherwise, the correlations becomes negative, the alpha drops, and it appears like a disaster. But it’s nothing more than a data entry error. Negative alphas is flagged by the calculator as an invalid warning. Don’t read too much into a negative number; that’s not some kind of profound insight. That’s just a coding scheme check.
This is another view of standardized alpha. It also takes into account that every item has same amount of variance. In reality, they never do. But it allows you to compare across scales with varying response ranges. So if your standardized alpha is significantly larger than your standard alpha, then your items has unequal variance. This means one may be tightly distributed and another widely distributed. This is not necessarily an issue with the quality of your scale, but simply an indication that the variance isn’t equal. The tool will help break that down and show how far off the two measures are from each other.
To summarize, Cronbach alpha is not a judge; it’s a gatekeeper. Is this data coherent? Can I trust it? Does it matter if the underlying questions makes sense? No. You might have a perfect measure of something that doesn’t matter. Clean up the noise with the tool. But then exercise your judgment and decide whether or not the signal is worth listening to. Always be trying to measure what you think you’re measuring, while avoiding adding static to the conversation.