Hourly to Salary Calculator
Convert any hourly wage into weekly, biweekly, semi-monthly, monthly, and annual pay, factor in overtime and time off, or reverse a salary back into an equivalent hourly rate.
🎯Real Wage Presets
📝Pay Inputs
Used when direction is Hourly to Salary.
Used when direction is Salary to Hourly.
🔢Pay Snapshot
📊Pay Period Breakdown
| Pay Period | Checks / Year | Gross per Period | Notes |
|---|---|---|---|
| Enter values above to build the pay period breakdown. | |||
💵Hourly Wage to Annual Reference
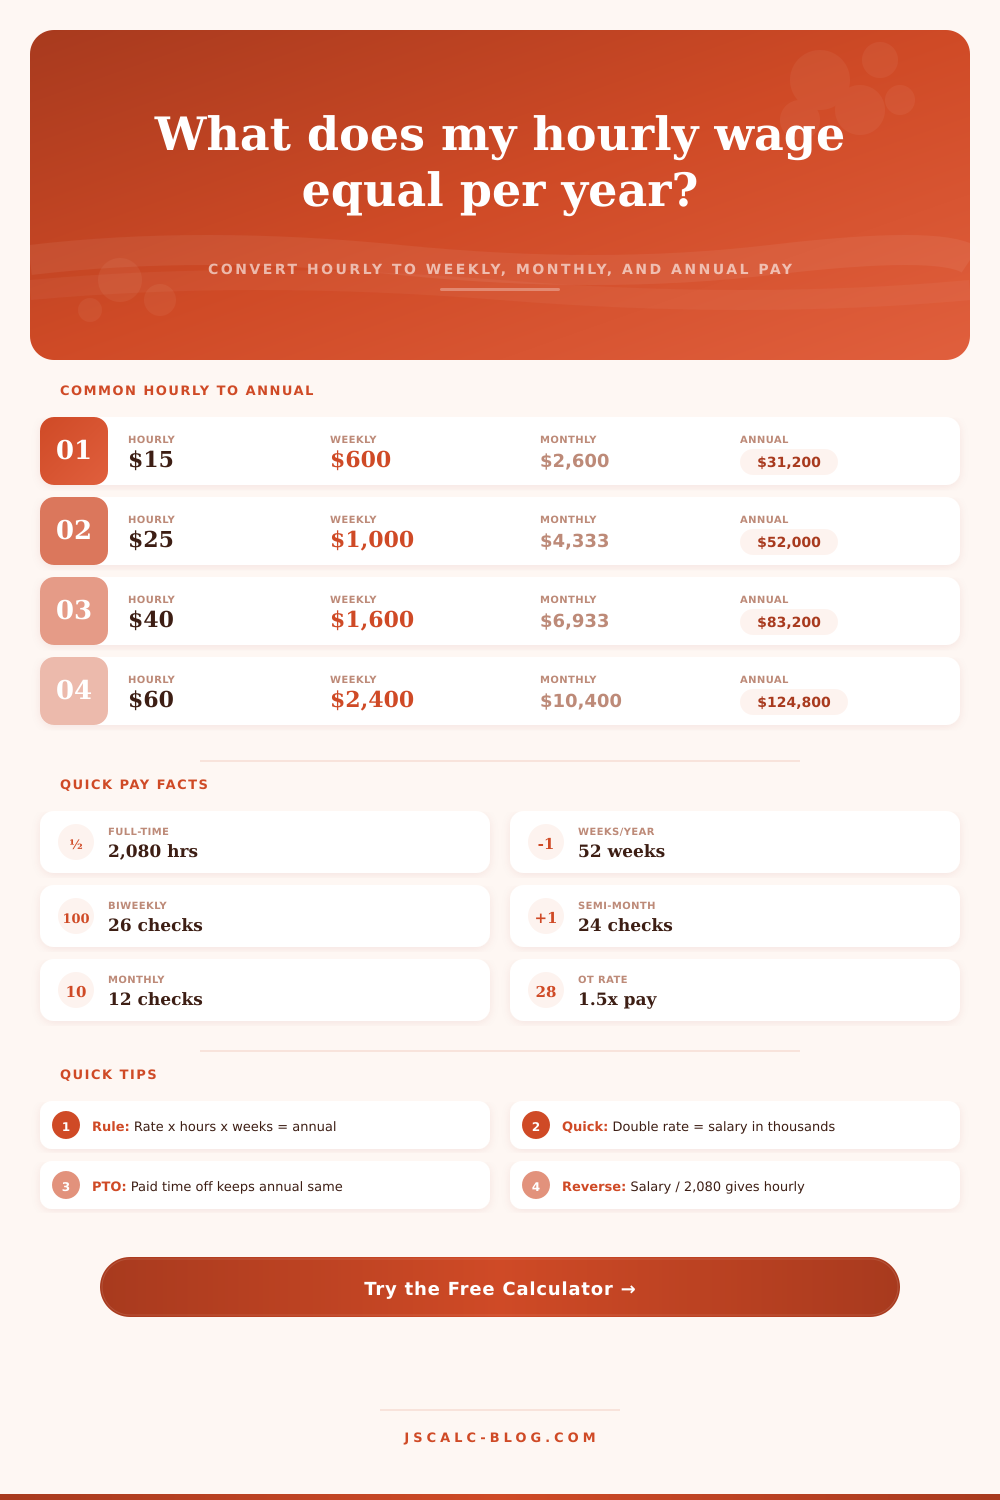
Based on a standard 40-hour week across 52 weeks (2,080 hours per year). Your current rate is highlighted when it matches a row.
| Hourly Rate | Weekly (40h) | Monthly | Annual (2,080h) |
|---|---|---|---|
| Reference table loads on calculation. | |||
⏱Hours-Per-Week Impact
Same hourly rate, different schedules. Shows how weekly hours change annual pay from part-time to full-time.
| Schedule | Hours/Week | Weekly Pay | Annual Pay |
|---|---|---|---|
| Schedule comparison loads on calculation. | |||
🔁Annual Salary to Hourly Reference
Common salaries divided by 2,080 full-time hours to find the equivalent hourly wage.
| Annual Salary | Monthly | Biweekly | Hourly (2,080h) |
|---|---|---|---|
| Reference table loads on calculation. | |||
🗂Wage Scenario Comparison
| Scenario | Hourly | Hours/Wk | Weeks | Weekly | Annual |
|---|---|---|---|---|---|
| Minimum wage full-time | $7.25 | 40 | 52 | $290 | $15,080 |
| Retail associate | $15.00 | 40 | 52 | $600 | $31,200 |
| Skilled trade | $25.00 | 40 | 52 | $1,000 | $52,000 |
| Registered nurse | $40.00 | 36 | 52 | $1,440 | $74,880 |
| Senior specialist | $50.00 | 40 | 52 | $2,000 | $104,000 |
| Contractor rate | $75.00 | 40 | 48 | $3,000 | $144,000 |
| Part-time helper | $18.00 | 20 | 52 | $360 | $18,720 |
| Overtime heavy | $30.00 | 50 | 52 | $1,650 | $85,800 |
⚙Formula and Method
📋Pay Period Reference
| Term | Checks/Year | Divisor | What It Means |
|---|---|---|---|
| Weekly | 52 | Annual / 52 | Paid every week, smaller checks |
| Biweekly | 26 | Annual / 26 | Every two weeks, two extra months |
| Semi-monthly | 24 | Annual / 24 | Twice a month on set dates |
| Monthly | 12 | Annual / 12 | Once a month, largest checks |
| Daily | Varies | Weekly / days | Pay for a single workday |
💡Practical Pay Tips
Sometimes I’m offered a job that pays me $50,000 per year, and I have another that pays me $25/hour.” It’s hard to know which is preferable; they don’t even seem like comparable thing. One is expressed in terms of dollars earned per year. The other are expressed in terms of dollars earned per hour.
The problem isn’t that you made a dumb math mistake. The problem are your visualization of money. An hourly wage has immediate concreteness: “I’ll get paid for every hour I work.” A salary feel abstract: “There will be a big chunk of money coming my way once every twelve month.
How to Compare Hourly Pay and Annual Salary
To make these two amounts comparable, convert one into the other. Then you can look at both figures side-by-side, doing minimal mental math to decide what works best for you.
In the traditional model, you assume that you work 40 hours per week, 52 weeks per year: That’s a total of 2,080 hours worked per year. Multiply that figure by your pay rate to get your base level of earnings. From there, add in any vacation time or overtime. A conversion calculator can helps prevent mistakes when converting your figures. It will also let you reverse the calculation to find your hourly rate from a specific salary. That way you’ll know if a raise being offered is real, or if they’re just expecting you to work longer hours.
The effects of time off on your effective earnings can be confusing to worker. When you’re getting paid time off, your base annual salary stay the same even though you’ve taken weeks off from work. You get paid the exact same amount for less work. Therefore, you have fewer hours worked than before, which lowers your effective hourly wage.
By contrast, unpaid time off lower the number of weeks for which you will recieve pay. As long as your base rate doesn’t drop, the only consequence is that your yearly total will go down accordingly. This is why so many people think they’re being given extra compensation for taking vacation days, but that money had already been part of their initial salary offer. This prevents any surprise when your take-home pay stays the same despite you working fewer hours.
Complicating things further, some jobs feature variable multipliers during overtime. For example, under standard labor laws, employees must be paid 1.5 times their normal rate of pay after working more than 40 hours per week. Certain positions may also include double-time rates on weekends/holidays. While these premium hours boost your take-home pay, they don’t alter your overall compensation package.
Enter expected overtime hours into the calculator to see its impact on your gross wages. If your job is highly variable (i.e., if you work very different schedules from one month to another), this will help you estimate your earnings more accurately so you know when to expect your baseline vs. Peak pay, which allows you to plan accordingly.
Your bank account doesn’t get all of what’s called “gross pay.” That number gets reduced by taxes, plus retirement and other benefit contributions. Depending on your withholding settings and location, a job with a salary of $50,000 may result in net pay of $35K to $40K before you spend a dime. This will also apply to hourly wage-earners, who will see these tax effects as a series of tiny paycheck reductions instead of a single large yearly adjustment. Knowing the distinction between net and gross pay rounds out the comparison.
When someone makes you a salary offer, they can make it sound really good… but dig into the details. Convert it to an hourly or daily number. Sixty hours a week at one-hundred grand isn’t as appealing than it seems. Your “hundred-grand job” is only worth whatever you recieve per hour of your life spent at work.
Translate every number to the hourly scale, then compare. That’s when you realize what it’s actualy worth; you’re no longer thinking about big annual numbers, you’re thinking about how much your actual life is worth when you work. It clarifies things in ways that a calculator could of never do.