Annual Percentage Yield Calculator
Convert a nominal annual rate and compounding frequency into effective APY, reverse an APY back into its nominal APR, compare savings accounts and CDs, and project the balance a stated yield produces over time.
🎯Real APY Presets
📝Yield Inputs
Switch the mode to run the reverse calculation or a growth projection.
Used for APY and projection modes.
Used when solving for the required nominal rate.
Optional. Added at the end of each month in projection mode.
🔢Formula Snapshot
🔄Same Rate, Every Frequency
| Compounding | Periods (n) | Nominal Rate | Effective APY | APY Gain vs Annual |
|---|---|---|---|---|
| Enter a nominal rate above to compare compounding frequencies. | ||||
📈Balance Growth At This APY
| Year | Start Balance | Deposits Added | Interest Earned | End Balance |
|---|---|---|---|---|
| The year-by-year growth appears after calculation. | ||||
📋Common Rate APY Reference (Daily Compounding)
| Nominal Rate | Daily APY | Monthly APY | Quarterly APY | Annual APY |
|---|---|---|---|---|
| 1.00% | 1.005% | 1.005% | 1.004% | 1.000% |
| 2.00% | 2.020% | 2.018% | 2.015% | 2.000% |
| 3.00% | 3.045% | 3.042% | 3.034% | 3.000% |
| 4.00% | 4.081% | 4.074% | 4.060% | 4.000% |
| 4.50% | 4.602% | 4.594% | 4.577% | 4.500% |
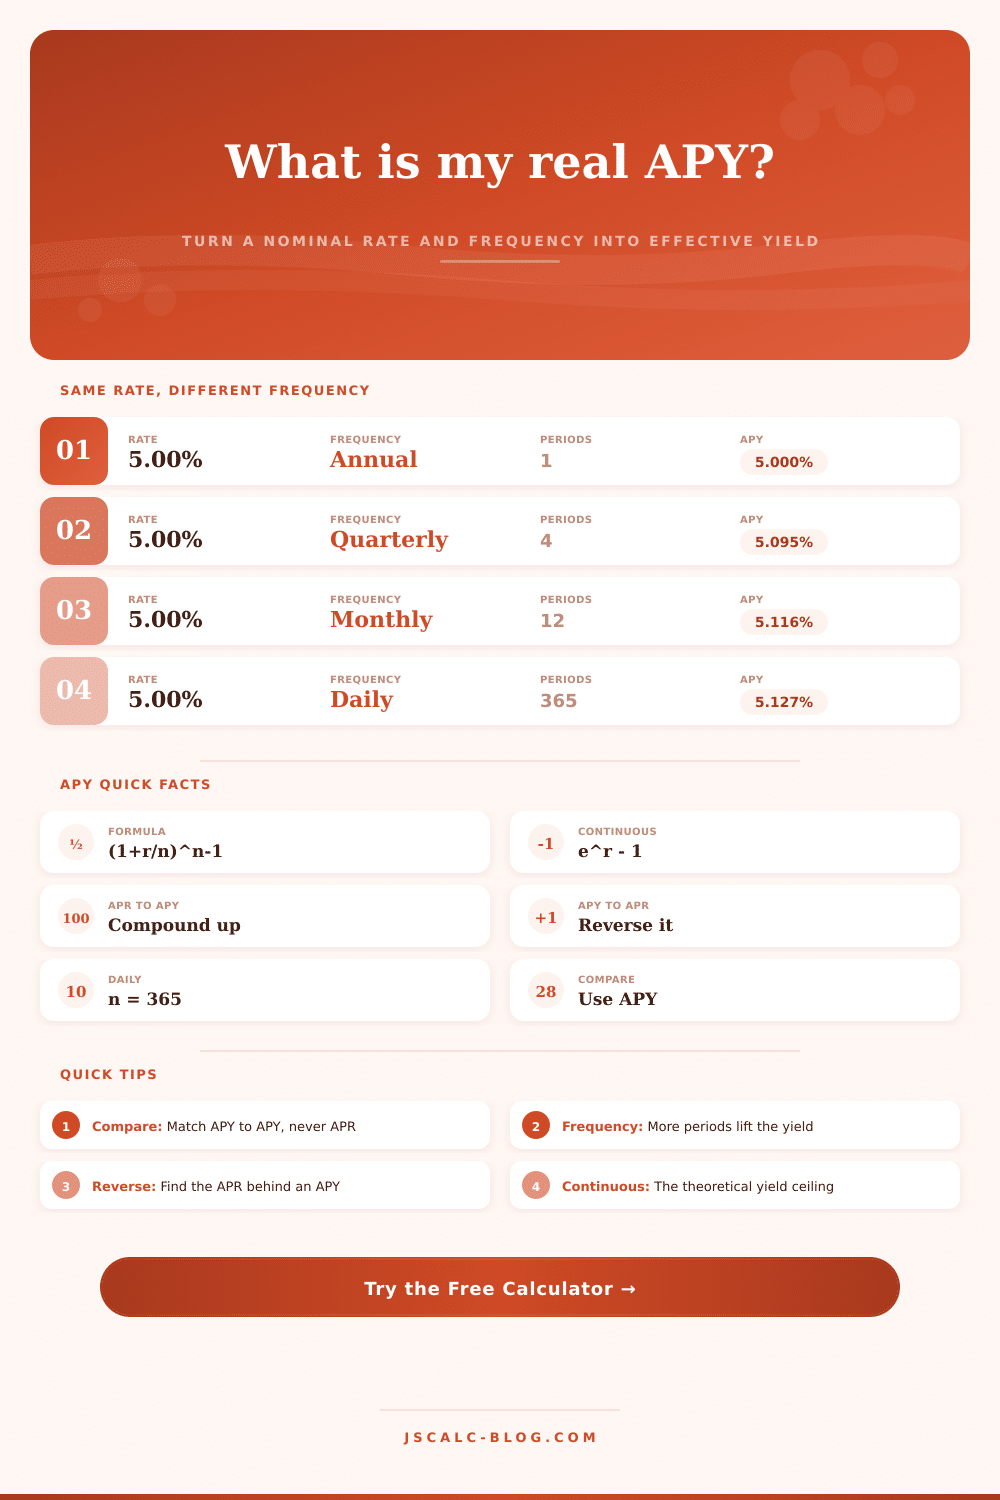
| 5.00% | 5.127% | 5.116% | 5.095% | 5.000% |
| 5.50% | 5.654% | 5.641% | 5.614% | 5.500% |
| 6.00% | 6.183% | 6.168% | 6.136% | 6.000% |
↩APY to APR Reversal Reference
| Advertised APY | APR if Daily | APR if Monthly | APR if Quarterly | APR if Continuous |
|---|---|---|---|---|
| 3.00% | 2.956% | 2.960% | 2.967% | 2.956% |
| 4.00% | 3.922% | 3.928% | 3.941% | 3.922% |
| 4.50% | 4.402% | 4.410% | 4.426% | 4.402% |
| 5.00% | 4.879% | 4.889% | 4.909% | 4.879% |
| 5.25% | 5.117% | 5.128% | 5.150% | 5.117% |
| 5.50% | 5.354% | 5.366% | 5.390% | 5.354% |
| 6.00% | 5.827% | 5.841% | 5.870% | 5.827% |
🗂Account and CD Comparison Grid
| Account Type | Nominal Rate | Compounding | Effective APY | $10k After 1 Yr | Access |
|---|---|---|---|---|---|
| Big-bank savings | 0.40% | Monthly | 0.401% | $10,040 | Anytime |
| High-yield savings | 5.12% | Daily | 5.253% | $10,525 | Anytime |
| Money market | 4.85% | Daily | 4.969% | $10,497 | Limited |
| 6-month CD | 5.15% | Monthly | 5.273% | $10,527 | Locked 6 mo |
| 12-month CD | 5.00% | Monthly | 5.116% | $10,512 | Locked 1 yr |
| 18-month CD | 4.60% | Quarterly | 4.680% | $10,468 | Locked 18 mo |
| Rewards checking | 4.00% | Daily | 4.081% | $10,408 | Anytime |
| Treasury bill (annualized) | 4.90% | Annual | 4.900% | $10,490 | At maturity |
⚙Full Formula Breakdown
📊APY vs APR Field Guide
| Term | What It Measures | Includes Compounding? | Use It To |
|---|---|---|---|
| APR | Simple stated yearly rate | No | Read the headline rate |
| APY | Effective yearly yield | Yes | Compare real earnings |
| Periodic rate | Rate per compounding period | One period | Build the growth factor |
| Continuous | Limit as n grows infinite | Maximum | See the yield ceiling |
💡Practical APY Tips
When most folks look at a savings rate, they move on. Five percent? I can do that, they say to themselves. That’s my money. It usualy is not. Most banks bury the distinction between what they promise and what they pay you in the frequency of interest payments. Seems small. Except that it determine if your thousand bucks turns into a thousand twelve or a thousand ten come year end.
That’s where the calculator (above) comes in: It spares you the work of converting, factoring, and guessing at those coefficients. Just plug in the nominal rate and the compounding frequency, and it’ll do the math for you. Enter the headline number the bank touts. Choose how frequently that interest will compound per year. For CDs, monthly is typical. For high yield accounts, daily is standard. With large institutions, quarterly appears more often then you might think.
How Compound Interest Works
And the tool converts this math into an effective annual percentage yield, the number that tells you precisely what you’re earning, after all the compounding has taken place. It puts everyone on equal footing so you can compare apples to apples without getting tripped up by the fine print. That’s all to say: How much something compounds isn’t as important than how frequently it compounds.
To understand this, we need to examine the mechanism of compound interest: You’re getting paid by the bank not only on what you initially deposit, but also on the interest you’ve earned so far. The more frequently it compounds, the faster you can begin re-investing that money. With daily compounding, you’re adding those small increments day after day. With annual compounding, you wait a whole year before allowing your interest to earn interest. Month-to-month will out-compound quarter-to-quarter; and daily will beat them both.
What may seem like small differences in black-and-white could be huge over time (especially if you have big balances). A hundred bucks won’t make much difference. But a hundred-thousand bucks? There are many investors who attempt to reverse engineer these rates: what’s the nominal rate underpinning an advertised yield? For example, if you notice a promotional offer with an APY that’s too good to be true, you can use this to work backwards and understand what base rate the institution is realy crediting. If the difference between the advertised APY and the implied APR is enormous, then it could mean either an aggressively-marketed product, or some complicated fee structure that’s hiding in plain sight.
You can toggle between modes on the calculator to switch back and forth instantly. What it does is strip away the promotional shine, letting you see how the account actualy works. Everything compounds here; which means that time matters. Because your starting amount is low, compounding happen slowly. First it compounds slowly. Then it compounds quickly as all those dollars of interest start making real secondary returns on themselves. Which is why if you don’t need the money now, it makes sense to lock it up in something with a longer time frame. It is a trade between access and growth. You’re trading one for the other.
The tool shows what that compounder looks like over any horizon you specify. Two years? Thirty years? It brings the expected balance forward and helps ground your expectations. It converts these percentages into dollar amounts that you can wrap your mind around. Banks compete on nominal rates, which are the numbers that look good in headlines. Four point nine percent is impressive compared to three percent. But what if one compounds daily while the other do so once per year? But if the first one compounds annually and the second compounds daily, the second one might actualy earn you more. Compare APY to APY only. Don’t get these mixed up.
This matters a lot over time. It’s also a little thing. The page has a clear table of examples for common rates. You can see how changing compounding from daily to annual changes the effective yield upwards. The calculator doesn’t factor in several other things. Nominal returns get eaten by inflation. Unless you save in tax advantaged account, your real take home will be less after taxes. That lowers the joy of high returns. A six percent return sounds awesome, until you realize it’s three percent after inflation and maybe another chunk taken out for taxes. So the headline number overstates how much your purchasing power is growing. You’re still ahead of where you were before, but beating zero isn’t as good as losing ground to inflation.
Identify your objective first… Then find an account that fits If you want to get at your money ASAP: use a high-yield savings account. Got some lock-up capital? CDs are frequently available with a bit higher rate if you can be patient. Tinker around with the tool until it feels like the right number for you. Understanding how to interpret exactly what you’re measuring is the key. The rest is just noise. Stated rates become clear. You no longer chase rates; you follow yield.