Home Loan Affordability Calculator
Work backward from your income, monthly debts, down payment, and lender DTI limits to find the maximum home price, loan amount, and monthly PITI payment you can realistically afford.
🎯Real Buyer Presets
📝Income & Loan Inputs
Car, student loans, credit cards, and other recurring loan minimums.
🔢Affordability Snapshot
📊Monthly Budget Breakdown
| Component | Monthly Amount | Share of PITI | Notes |
|---|---|---|---|
| Enter values above to see the monthly budget breakdown. | |||
💵Income-to-Affordability Quick Guide
| Annual Income | Monthly Income | Max PITI (back-end) | Est. Max Home Price |
|---|---|---|---|
| The income table appears after calculation. | |||
Estimates use your current rate, term, debts, down payment, and reserve settings. Only the income figure changes down the rows.
📉How the Rate Moves Your Max Price
| Interest Rate | Payment Factor | Max Loan | Max Home Price | Change vs Base |
|---|---|---|---|---|
| The rate sensitivity table appears after calculation. | ||||
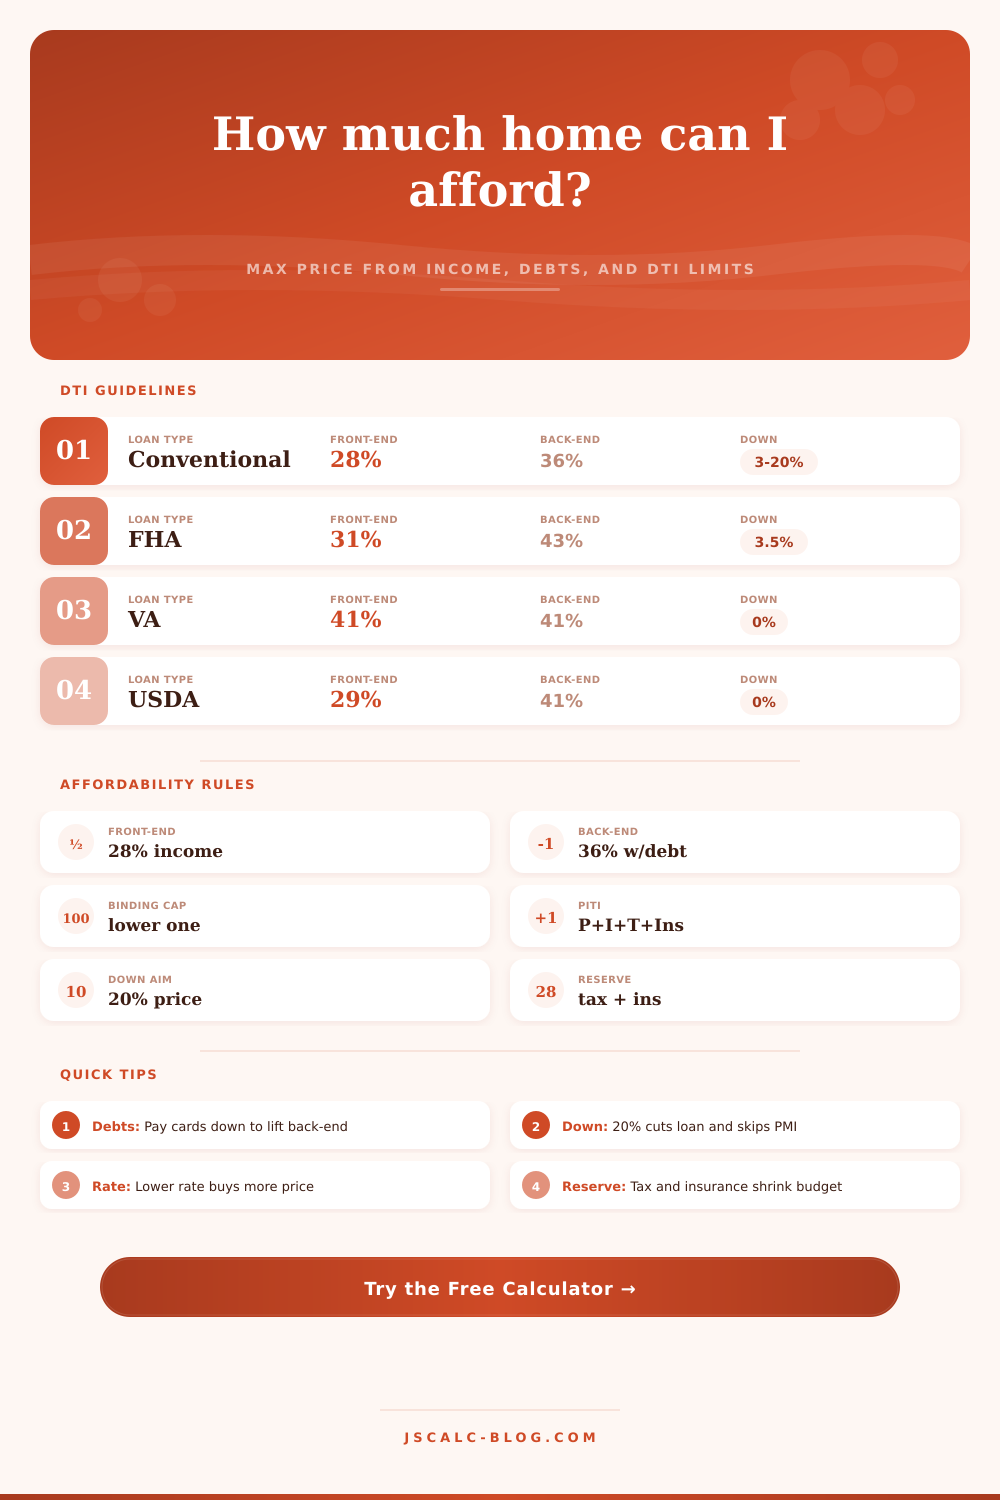
📋DTI Guidelines by Loan Type
| Loan Type | Front-End DTI | Back-End DTI | Typical Down | Notes |
|---|---|---|---|---|
| Conventional | 28% | 36% | 3% to 20% | Under 20% down adds PMI |
| Conventional (stretch) | 28% | 45% | 3% to 20% | Strong credit and reserves |
| FHA | 31% | 43% | 3.5% | Flexible credit, MIP applies |
| VA | 41% | 41% | 0% | Eligible service, residual test |
| USDA | 29% | 41% | 0% | Rural areas, income caps |
| Jumbo | 28% | 43% | 10% to 20% | Above conforming limit |
🗂Down Payment Comparison Grid
| Down % | Down $ Needed | Loan Amount | LTV | PMI? | Note |
|---|---|---|---|---|---|
| The down payment comparison appears after calculation. | |||||
Rows hold your calculated max home price steady and show what each down payment level implies for loan size, LTV, and PMI.
⚙Method & Formula Breakdown
💡Affordability Tips
Don’t begin with a price tag posted on the web. Instead, back into what you can afford; i.e., start with your paycheck. The sticker price isn’t what matters; that’s just something designed to distract from your budget limits. Your goal is to know exactly how much each property will cost every month, not just what the sticker price is. Because the asking price won’t necessarily reflect the full monthly cost, this approach keep your hunt in real-world territory. By setting a spending cap based off your income, you defend against market madness while maintaining an affordable budget.
Your debt-to-income ratio matters (a lot). It’s how lenders determine whether or not you’re capable of making those payments. This ratio show how much money you have going toward housing compared to your income; this is called the front end. It also looks at the big picture by taking into account other monthly payment like credit cards, student loans, and child support. This is known as your back-end ratio. Lenders don’t want to see this ratio creep upwards, since they don’t want borrowers who aren’t able to make their mortgage payment in addition to handling life’s little curveballs.
How to Figure Out How Much House You Can Afford
Your ability to purchase depends greatly on interest rates, probably more so than most buyers know. As rates climb, it costs more to borrow money, which reduce your buying power. For example, an incremental half-percentage-rate hike can dramatically decrease size of mortgage your income will support. That’s true not only for your monthly payment today, but also for all the debt you’ll carry over the next three decades. The calculator accounts for that and factors in shifting rates across principal, interest, taxes and insurance.
Insurance and property taxes are non-negotiable parts of your monthly mortgage payment. Depending on where you live, property taxes can eat up to 10 percent of your housing cost. By failing to account for this expense, you end up guessing how much you can afford in an incorrect way. Before it determines your max mortgage size, the tool remove those tax-and-insurance reserves from your total budget, forcing you to only choose homes that are realistically within reach after accounting for these expenses.
There’s a tactical decision that comes with making a downpayment… Between short term cashflow vs. Long term equity. If you put 20% down, you’ll avoid Private Mortgage Insurance (PMI). Which will save you money long term as you won’t have an additional monthly expense. But it takes some time to save for a large downpayment. If you wait too long, you may end up paying more as market prices goes up, or you might miss out on homes before they sell again. By making a smaller down payment, you can get into the market sooner… but this means a bigger loan and thus higher monthly bills. Consider how much it’ll impact your immediate budget and the rewards of building equity early on.
Your credit score isn’t just a matter of whether or not you get approved… It’s also about what rate you’re offered. Generally speaking, the better your score is, the lower that rate will be. The lower your rate is, the more expensive home you can qualify for while keeping your mortgage payment the same. Even if you’re only able to boost your score by 20 points, this could save you thousands throughout the duration of your loan term, and it can be used significanty. Too many buyers wait until closing time before realizing their credit matters; fix these problems ASAP to ensure that you’ve got the maximum amount of money to work with.
Homeownership isn’t just the pursuit of the biggest home you can afford. It’s about establishing a sturdy financial foundation capable of weathering life’s storms. When life happens (e.g. Increased costs, job loss) there’s no wiggle room if you live on a shoestring. The peace-of-mind from having some breathing space in your monthly cash flow is worth more than any additional square footage. The mission is to identify a home that comfortabley falls within your budget, so your largest asset does not become a burden.
You should of used the numbers to direct your search, and let your emotions take over only after the calculations support the decision.