First-Time Home Buyer Affordability Calculator
Estimate the maximum home price and loan you may qualify for using the classic 28/36 debt-to-income rule, your down payment, mortgage rate, term, property taxes, and insurance.
🎯First-Time Buyer Presets
📝Income & Loan Inputs
Enter yearly or monthly to match the basis above.
Car, student, credit card, and other minimums.
Housing payment as a share of income. Classic 28%.
Housing plus all debts. Classic 36%.
🔢Affordability Formula Snapshot
⚙How the 28/36 Rule Backs Out Your Loan
📋The 28/36 Rule Explained
| Ratio | Limit | What It Covers | At $6,000/mo | Why Lenders Use It |
|---|---|---|---|---|
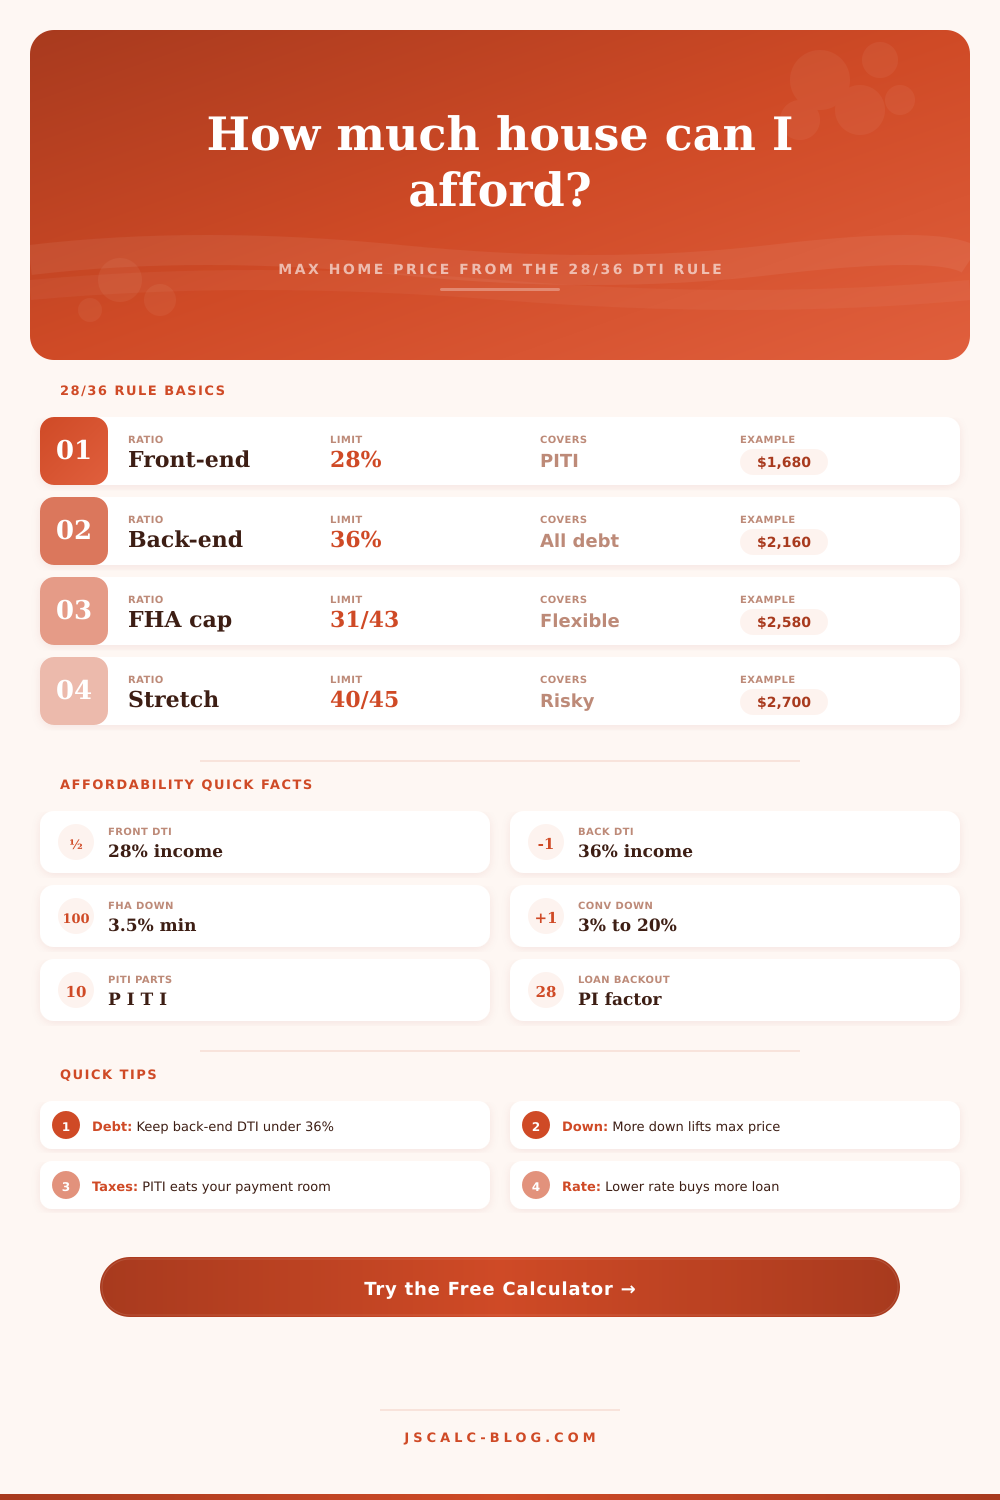
| Front-end (housing) | 28% | PITI: principal, interest, tax, insurance | $1,680 | Keeps the house payment affordable |
| Back-end (total) | 36% | Housing plus all other monthly debt | $2,160 | Leaves room for life and savings |
| FHA front-end | 31% | PITI plus mortgage insurance | $1,860 | More flexible for first-time buyers |
| FHA back-end | 43% | Housing plus all debts | $2,580 | Allows higher debt with compensating factors |
| Stretch limit | 40% / 45% | Aggressive housing and total debt | $2,700 | Possible but leaves a thin cushion |
💵Affordability by Income (28% Rule, No Debt)
| Annual Income | Monthly | 28% PITI Cap | P&I After $350 Escrow | Est. Max Loan | + 10% Down Price |
|---|---|---|---|---|---|
| $40,000 | $3,333 | $933 | $583 | $92,200 | $102,400 |
| $55,000 | $4,583 | $1,283 | $933 | $147,600 | $164,000 |
| $72,000 | $6,000 | $1,680 | $1,330 | $210,400 | $233,800 |
| $90,000 | $7,500 | $2,100 | $1,750 | $276,800 | $307,600 |
| $110,000 | $9,167 | $2,567 | $2,217 | $350,600 | $389,600 |
| $140,000 | $11,667 | $3,267 | $2,917 | $461,400 | $512,600 |
| $175,000 | $14,583 | $4,083 | $3,733 | $590,400 | $656,000 |
Estimated at 6.5% APR over 30 years. Actual figures shift with rate, term, taxes, insurance, and other debts.
🏦Down Payment Programs at a Glance
| Program | Min Down | Credit Guide | Mortgage Insurance | Best For |
|---|---|---|---|---|
| FHA loan | 3.5% | 580+ typical | Upfront + monthly MIP | Lower credit, small down |
| Conventional 97 | 3% | 620+ typical | PMI until 20% equity | Good credit, low down |
| Conventional 20% | 20% | 620+ typical | None | Avoiding PMI |
| VA loan | 0% | Lender set | None (funding fee) | Veterans and service members |
| USDA loan | 0% | 640+ typical | Guarantee fee | Eligible rural areas |
🗂Income vs Max Price Comparison Grid
| Monthly Income | Monthly Debts | Front Cap (28%) | Back Room (36%) | Max PITI | Est. Max Loan | Max Price + $20k Down |
|---|---|---|---|---|---|---|
| $4,000 | $0 | $1,120 | $1,440 | $1,120 | $121,700 | $141,700 |
| $4,000 | $500 | $1,120 | $940 | $940 | $93,300 | $113,300 |
| $6,000 | $0 | $1,680 | $2,160 | $1,680 | $210,400 | $230,400 |
| $6,000 | $600 | $1,680 | $1,560 | $1,560 | $191,400 | $211,400 |
| $8,000 | $400 | $2,240 | $2,480 | $2,240 | $298,900 | $318,900 |
| $10,000 | $700 | $2,800 | $2,900 | $2,800 | $387,400 | $407,400 |
| $12,000 | $1,000 | $3,360 | $3,320 | $3,320 | $469,700 | $489,700 |
| $15,000 | $1,200 | $4,200 | $4,200 | $4,200 | $608,900 | $628,900 |
Assumes $350/mo taxes and insurance, 6.5% APR, 30-year term. The binding cap is whichever ratio is smaller after debts.
📊DTI Limits by Loan Type
| Loan Type | Front-End DTI | Back-End DTI | Notes |
|---|---|---|---|
| Conventional (classic) | 28% | 36% | The traditional 28/36 benchmark |
| Conventional (max) | Often waived | Up to 45% to 50% | With strong credit and reserves |
| FHA | 31% | 43% (up to 50%) | Flexible with compensating factors |
| VA | No hard front | 41% guideline | Residual income test applies |
| USDA | 29% | 41% | Rural eligibility required |
💡First-Time Buyer Tips
This is an educational affordability estimate based on the 28/36 debt-to-income framework, not a loan preapproval or lending offer. Actual qualifying amounts depend on credit, reserves, mortgage insurance, and full lender underwriting.
When you begin your house hunt, you’re typically armed with a budget, and that budget might have been pulled out of thin air. You saw a picture on Zillow, fell in love, and forgot about the math. “It has a nice kitchen.” Yep. But how are you going to pay for that nice kitchen? Your heart wants one thing; your wallet can afford anotherthing.
That’s where this tool reverses the process: Instead of shopping for homes based off an imaginary number (the price), you’ll begin with a real-life number (your income/debts). In other words, you’ll be forced to consider what you can afford, instead of what you WANT. And I think that’s a great idea.
How to Find Out What House You Can Afford
This all hinges on the long-standing 28/36 rule: a decades-old metric that lenders have relied upon for decades as a gauge for how risky it is for you to borrow money. Your housing costs shouldnt exceed 28 percent of your gross monthly income, i.e., your principal & interest + taxes & insurance payments. Your total debt payments should not exceeds 36 percent of your gross monthly income, i.e., the sum of your mortgage payment PLUS all other recurring expenses, such as student loans, auto payments, credit card bills, etc.
Why? Because lenders has witnessed firsthand the consequences of borrowers pushing past those boundaries. When your housing-related costs is greater than one-third of your paychecks, defaults increases significantly.
But here’s what most buyers overlook: Insurance and taxes consume a large chunk of that 28% limit. Your mortgage might seem reasonable at $1,600 per month … until you learn half goes to homeowners insurance and property taxes. Neither of these payments reduces your mortgage balance, but both rob your bank account just the same.
The calculator factors this in when calculating how much “principal + interest” you can handle. It estimates your insurance and taxes (then deducts them), then sees if you’re left with enough money to pay a mortgage. Why? Because that number represents the actual loan size you qualify for. And that figure is usually far smaller than a back-of-the-napkin guess using only monthly payment.
In this scenario, your down payment serves a different purpose: It’s an immediate way to nudge your max home purchase price higher. In other words, if your debt-to-income ratio allow you to take on X dollars of a loan, then any extra money you save adds up, it can go toward additional housing costs. By saving up a bigger down payment, you can get rid of private mortgage insurance, which will free up some breathing room for your principal + interest payments.
This is yet another reason it makes sense to save aggressively prior to purchasing; saving more often yields better results then trying to maximize every dollar of borrowing power. Planning ahead puts you closer to your target
The tool also accounts for interest rates, which add another wrinkle into the equation. If your income is fixed, an increase in interest rates will reduce your buying power. The monthly payments on your desired house balance goes up by a few hundred bucks, knocking tens of thousands of dollars from the amount you qualify to borrow. In high-rate environments, it’s less about timing and more about being patient. It may be worth waiting for rates to fall, but you’ll often get a bigger boost by paying down debt or improving your credit score.
Reducing your non-housing debts increase your 36% back-end limit. That creates additional wiggle-room for a mortgage payment (without altering your salary). While debt-to-income ratios appears as hard lines on a piece of paper, they change in real-life scenarios. One moment you’re at a comfortable 30% DTI, and the next day you lose your job or have an emergency repair. Before long, your comfortable debt ratio becomes a stressful one.
To be safe, err on the side of caution when approaching max debt. Don’t reach the thresholds recommended by the debt-to-income ratio calculator. Having a loan qualify you doesn’t mean you’ll also be able to afford it comfortabley. You want a home that fits into your current life. Leave room for the unexpected challenges of being a homeowner.
Begin with the numbers, and follow your lifestyle for the finishing touch. You should of planned ahead.