Herfindahl Index Calculator
Compute market HHI from percentage or decimal shares, split fringe competitors, estimate effective firm count, and screen a simple merger under DOJ/FTC concentration thresholds.
Percent inputs produce a 0 to 10,000 HHI; decimal shares are converted internally.
Leave as 0 if there are fewer named firms.
The calculator splits any unlisted share equally across this many small firms.
HHI Results
Ready.
| Firm Group | Share | Decimal Share | HHI Points | Share of HHI |
|---|
| Measure | Threshold | Calculator Label | Meaning | Practical Check |
|---|---|---|---|---|
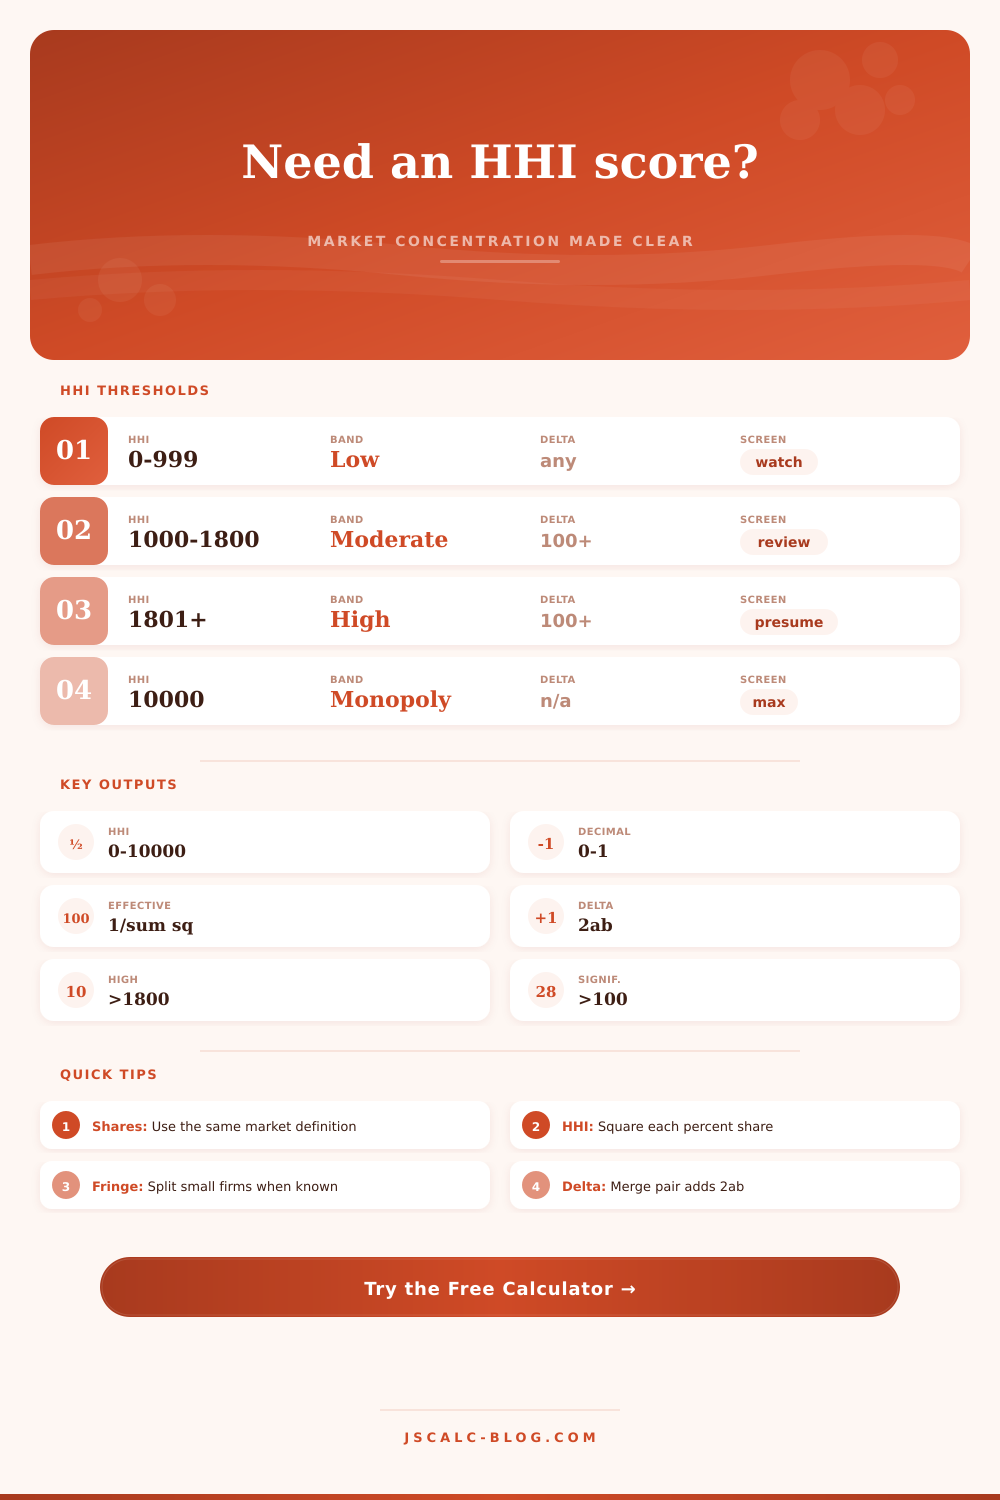
| HHI | Below 1,000 | Lower concentration | Many competitors or balanced shares | Still define the product and geography carefully |
| HHI | 1,000 to 1,800 | Moderately concentrated | Middle zone for concentration screens | Review share sources and fringe treatment |
| HHI | Above 1,800 | Highly concentrated | Current DOJ/FTC high-concentration screen | Merger deltas matter more in this zone |
| HHI delta | Above 100 | Significant increase | Merger meaningfully raises concentration | Delta equals 2 times merging percent shares |
| Structural presumption | Post HHI above 1,800 and delta above 100 | Presumption screen | Screen suggests closer antitrust review | Legal assessment depends on the full record |
| Single firm maximum | 10,000 | Monopoly limit | One firm has 100 percent share | HHI cannot exceed 10,000 using percentages |
| Market Pattern | Example Shares | HHI | Effective Firms | Readout |
|---|---|---|---|---|
| Ten equal firms | 10 each | 1,000 | 10.0 | Balanced but at the moderate line |
| Four equal firms | 25 each | 2,500 | 4.0 | Highly concentrated |
| Leader plus rivals | 40, 25, 15, 10, 10 | 2,450 | 4.1 | High because the leader is large |
| Dominant pair | 45, 35, 10, 5, 5 | 3,500 | 2.9 | Two firms drive most concentration |
| Fragmented market | 20, 15, 10, 10, plus fringe | About 800 | 12.5 | Lower concentration if fringe is real |
| Near monopoly | 85, 10, 5 | 7,350 | 1.4 | Very concentrated |
Concentration sounds like some theoretical concept from academia…until you’re trying to quantify it. The Herfindahl Index makes you view market shares not just as a series of number but as a system of power. Who is controlling the market?
Market share tends to be thought off linearly by most people. One company is four times bigger then the other if it has forty percent of the market and the other has ten percent. But the index squares out those market shares. And that is what matters most. It punishes fragmentation and rewards dominance in a way that raw percentages don’t reflect.
Understanding Market Power with the Herfindahl Index
Two markets might look exactly alike on paper, but act very differently under stress. Once you enter your firm size(s), the calculator do the rest for you, no need to guess at coefficients. It even considers the outliers, by far the biggest mistake made by analyst. You can’t just take all those little guys and lump them under one other. That will artificially increase concentration score.
Those little guys is competing; they’re still stealing market share. With this tool, you can divide that remaining portion into as many equal parts as you want. Why? Because it shows real-world competitive pressure in the tails of the market. Without considering them, the market appear tighter then it actualy is.
Regulators consider specific thresholds. When do they use them? For example, how do regulators know which mergers require their attention? Here’s how: The Federal Trade Commission (FTC) and the Department of Justice (DOJ) considers the absolute level of concentration (a score of 1,800+ indicates high concentration), as well as the change in the score due to the merger.
If the score rise by over 100, then they will take a closer look. These are not verdicts; these are screens. They indicate to investigators where to begin looking but don’t dictate what to uncover. Still, they are strong places to start.
The calculator will display both the pre-merger state and the post-merger change. Did you cross those lines? Is it time to walk away from the deal or brace yourself for a regulatory review? Often yes.
There is one more: the effective number of firms. This is another way to turn the messy reality of unequal market shares into a simple number. How many equal-sized competitors would generate the same degree of concentration? Ten companies on paper doesn’t mean much if their market act like a duopoly because the effective count is only two. Leverage is probably with one or two firm.
This can help explain why price competition may stays low while the names on the shelf add up to a long list. The structure shape the behavior.
The definition of the market matters, but with care. It’s no better than the shares that you feed into index. Define the market too narrowly, and all the firms appears enormous. Define it too broadly, and they all appear puny. You can’t define “the” market exactly. Only the best-supported definition of the market that you have.
The tool comes with some presets to show you what different industries looks like. Wireless carriers and cloud infrastructure look very different than local grocery chains. They are all very differnt. But the same pattern repeat in sector after sector. One dominant player and a few rivals is different than a group of equal competitors.
The math on that merger difference is pretty straight-forward: twice the product of both merging shares. So merging two small companies doesn’t do much to the overall score. Two big companies, though? A spike. That’s where regulators look. It is not just about getting bigger. They care if becoming larger eliminate meaningful competitors.
With that tool, you can see exactly how much the score jump and whether it moves you into a higher risk category.
Concentration also gives you a glimpse into the geometry of competition, because you’re seeing where power is both gathered and spread out. Power isn’t profit. The index does not predict profitability. (But more on that later.) The index doesn’t tell you if something will be profitable. Or even successful. It tells you the shape of the battlefront.
And once you’ve got this shape in mind, you could of decide whether to enter (or exit) an alliance. The numbers are just the map. The strategy is up to you. With this clarity, you’ll understand what the room actualy looks like.