Harmonic Mean Calculator
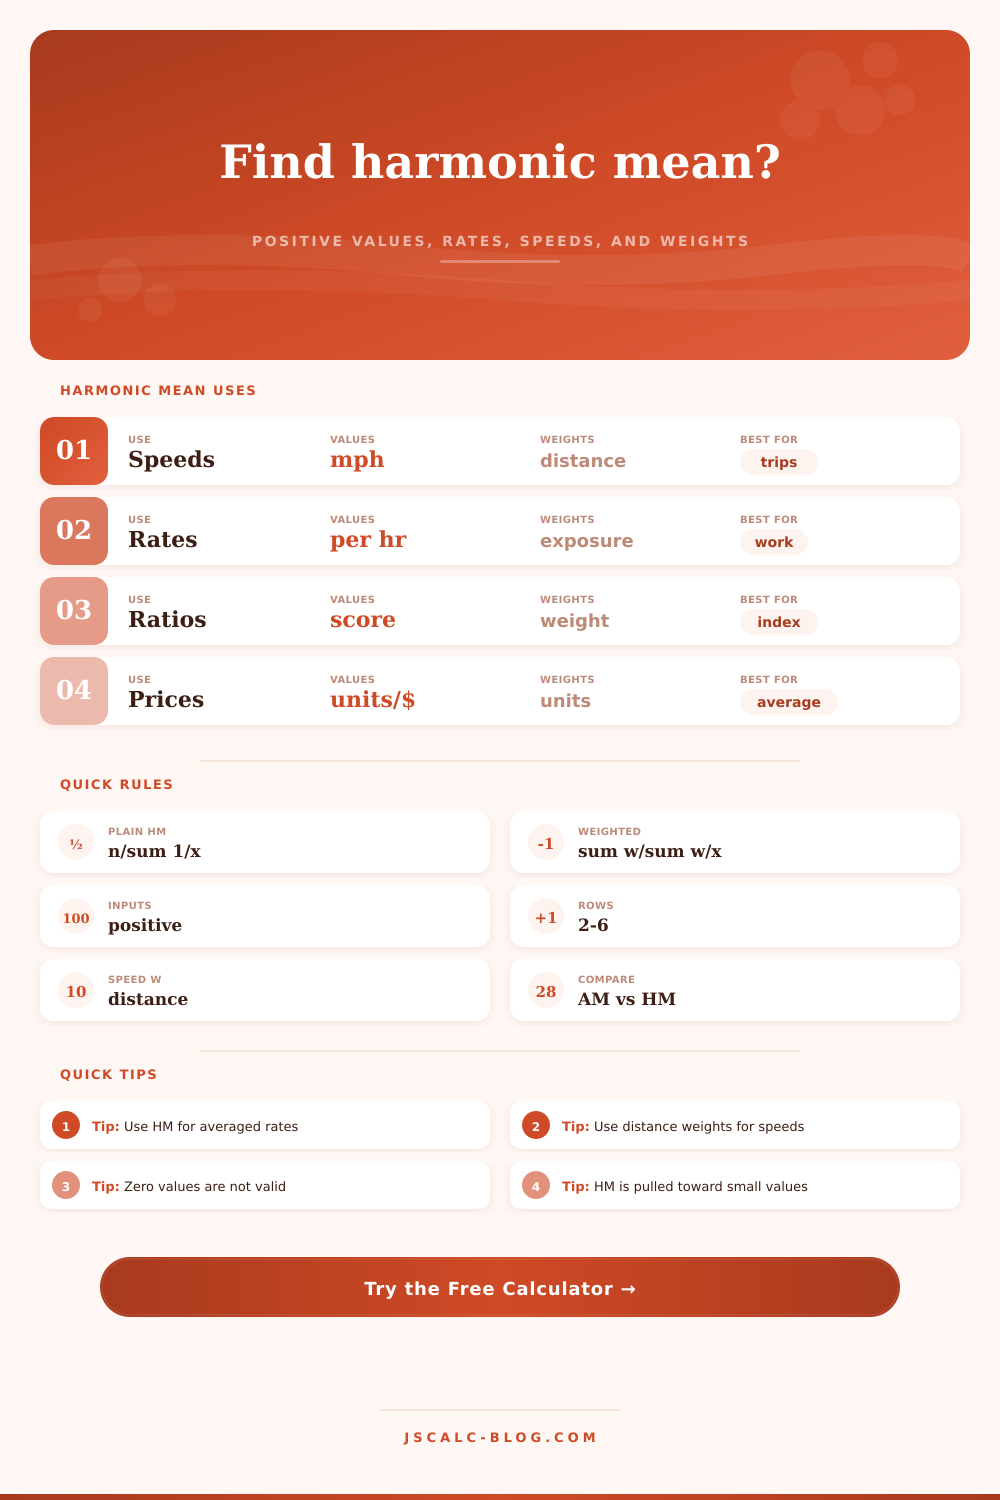
Calculate the harmonic mean for positive values, rates, speeds, and weighted scenarios using n / sum(1 / x) or sum(w) / sum(w / x).
Load a rate or speed scenario, then edit any row. Harmonic mean is best when the average should be pulled by the slower or smaller rates.
For plain mode, use the Value column. For weighted mode, use Value and Weight. For speed mode, enter Distance and Time; the calculator derives each row speed and uses distance as the weight.
| Use | Label | Value or rate | Weight | Distance | Time |
|---|---|---|---|---|---|
| Row | Rate used | Weight used | Reciprocal part | Time or exposure | Impact |
|---|---|---|---|---|---|
| Run the calculator to see row-level reciprocal contributions. | |||||
Best for averaging positive rates, speeds, ratios, and unit prices when each value is a denominator-like rate.
Use when exposures differ. For speeds over unequal distances, distance belongs in the weight column.
Best for additive quantities such as scores, heights, totals, and measurements that combine directly.
Best for multiplicative growth rates, compounded ratios, index changes, and proportional change over time.
| Scenario | Use harmonic mean when | Weight choice | Common mistake |
|---|---|---|---|
| Round-trip speed | Equal distances at different speeds | Equal distance or speed mode | Averaging 40 and 60 as 50 mph |
| Unequal route segments | Each segment has its own distance | Distance | Giving a short slow segment too much weight |
| Work rates | Rates are jobs per hour or pages per hour | Jobs, pages, or exposure | Averaging times instead of rates |
| Throughput | Systems process positive units per time | Requests, units, or batches | Ignoring the bottleneck rate |
| Financial multiples | Averaging ratios such as P/E across entities | Relevant exposure or equal entities | Using HM with negative ratios |
| Fuel efficiency | Values are distance per fuel unit | Distance | Averaging mpg across unequal mileage |
| Method | Formula | Positive rule | Interpretation |
|---|---|---|---|
| Plain harmonic mean | HM = n / sum(1 / x) | Every x must be greater than 0 | Average of equal-exposure positive rates |
| Weighted harmonic mean | WHM = sum(w) / sum(w / x) | Every x greater than 0; weights nonnegative | Average rate across unequal exposure |
| Speed mode | Total distance / total time | Distance and time must be greater than 0 | Same as distance-weighted harmonic speed |
| Arithmetic comparison | AM = sum(x) / n or sum(wx) / sum(w) | Values can be broad, but this tool keeps positives | Shows how much ordinary averaging overstates rates |
| Geometric comparison | GM = exp(sum(ln x) / n) | Every x must be greater than 0 | Sits between harmonic and arithmetic for positives |
If you drove sixty miles per hour to work and forty miles per hour back home, your intuitive arithmetic average would say you went fifty miles per hour that day. This is just one of many intuition traps that trip up drivers, investors, and engineers alike.
What’s missing? Time. You spent more time traveling slow than fast. The harmonic mean accounts for this. It corrects for the unbalanced weighting of your two travel times (faster versus slower). The mental gymnastics required to balance out reciprocal fractions is saved.
Why Simple Averages Are Wrong
All you do with the calculator above is plug in your distance segments. It figure it all out for you.
But the harmonic mean isn’t just some trick to use when computing commute time. For any rate where the denominator has meaning, such as a service’s throughput, a vehicle’s fuel efficiency, or even someone’s work rate, the harmonic mean is naturaly the correct average. You’re taking two speeds and averaging them out: basically, two ratios that divide into something else.
Did you get one-hundred requests processed in ten seconds? And another one-hundred in twenty seconds? No, you didn’t process them at an average of fifteen seconds per hundred. You took in more work than that. There was more “volume” done, so the tool gives you space to enter that volume directly.
That is how weighted mode works. It balances your long stretches of slow going with your shorter bursts of fast going so that neither unduly inflates nor deflates average.
What about fuel economy? Driving thirty mpg for a hundred miles isn’t the same as driving sixty mpg for a hundred miles, yet that’s not going to get you an average of forty-five mpg. You’ll have burned through half your tank before you even reach second leg. That’s where fuel burn enters the equation, through use of the harmonic mean. Because inefficiency is measured in absolute terms, it drags the average down.
Distance becomes weight in the speed calculation. As you can see from the reference table on the page, distance acts as the weight in speed calculations. That’s because distances don’t all mean equal time intervals. Most trips won’t be, so we need our math to mirror that reality.
The same reasoning applies for financial analysis: When valuing companies, analysts use multiples (e.g., price-to-earnings). When averaging those multiples over a portfolio, they must be careful. If one company has many more shares but a low multiple, it shouldn’t pull up the entire average. That’s why we look at the weighted harmonic mean, where the total market cap or earnings power is used as the weight. This way, it considers the ratio as a rate of return on price. This prevents a big company with a small multiple from pulling the whole thing up simply because it has many more shares.
Use the calculator in both “plain” and “weighted” mode and notice how it forces you to consider what is the denominator. What are you dividing by? Is it money? Is it time? Units of production?
Because the concept is tricky, the interface tries to make it straightforward. There’s no formula for the reciprocal sum to remember. Just know that smaller numbers has a huge impact. One really slow machine on a factory line will bottleneck everything else. The harmonic mean shows this bottleneck. Arithmetic mean hides it behind faster machines. This sensitivity isn’t a bug; it’s a feature. It protects you from overestimating capacity.
In the output panel, you can compare the value against the average to see the gap. The gap indicates how much distortion the ordinary average introduce. If it’s large, your rates were inconsistent. If it’s small, they were stable.
The validation is strict for this reason. Averaging a rate of zero doesn’t work. Zero divided by anything isn’t zero; it’s a break in math. The tool tells you so. That protects against dumb mistakes in your data entry. And, it serves as a reminder: Rates must be positive. In other words, neither speed nor throughput can be negative here.
Geometric means are somewhere between arithmetic and harmonic means. They give us middle ground when we’re talking about multiplicative growth. But where pure rates is concerned, the harmonic is the most honest. It acknowledges the resource or time cost of the slowest element in the process.
The presets will demonstrate how various situations apply. For example, in a symmetric round trip, the harmonic mean is simply twice the product of the speeds divided by their sum. But if you had an asymmetric situation, like a delivery route with multiple stops at different speeds, then you need weights. And that’s what the calculator does.
It should of been a rigid rule applied flexibly. What is the rule? The average rate of several rates requires weights proportional to the denominators.
With that in mind, using the calculator becomes intuitive. Guesswork gives way to calculation. What you get isn’t an approximation but a number corresponding to real life.
You move slower then you think.