Geometric Mean Calculator
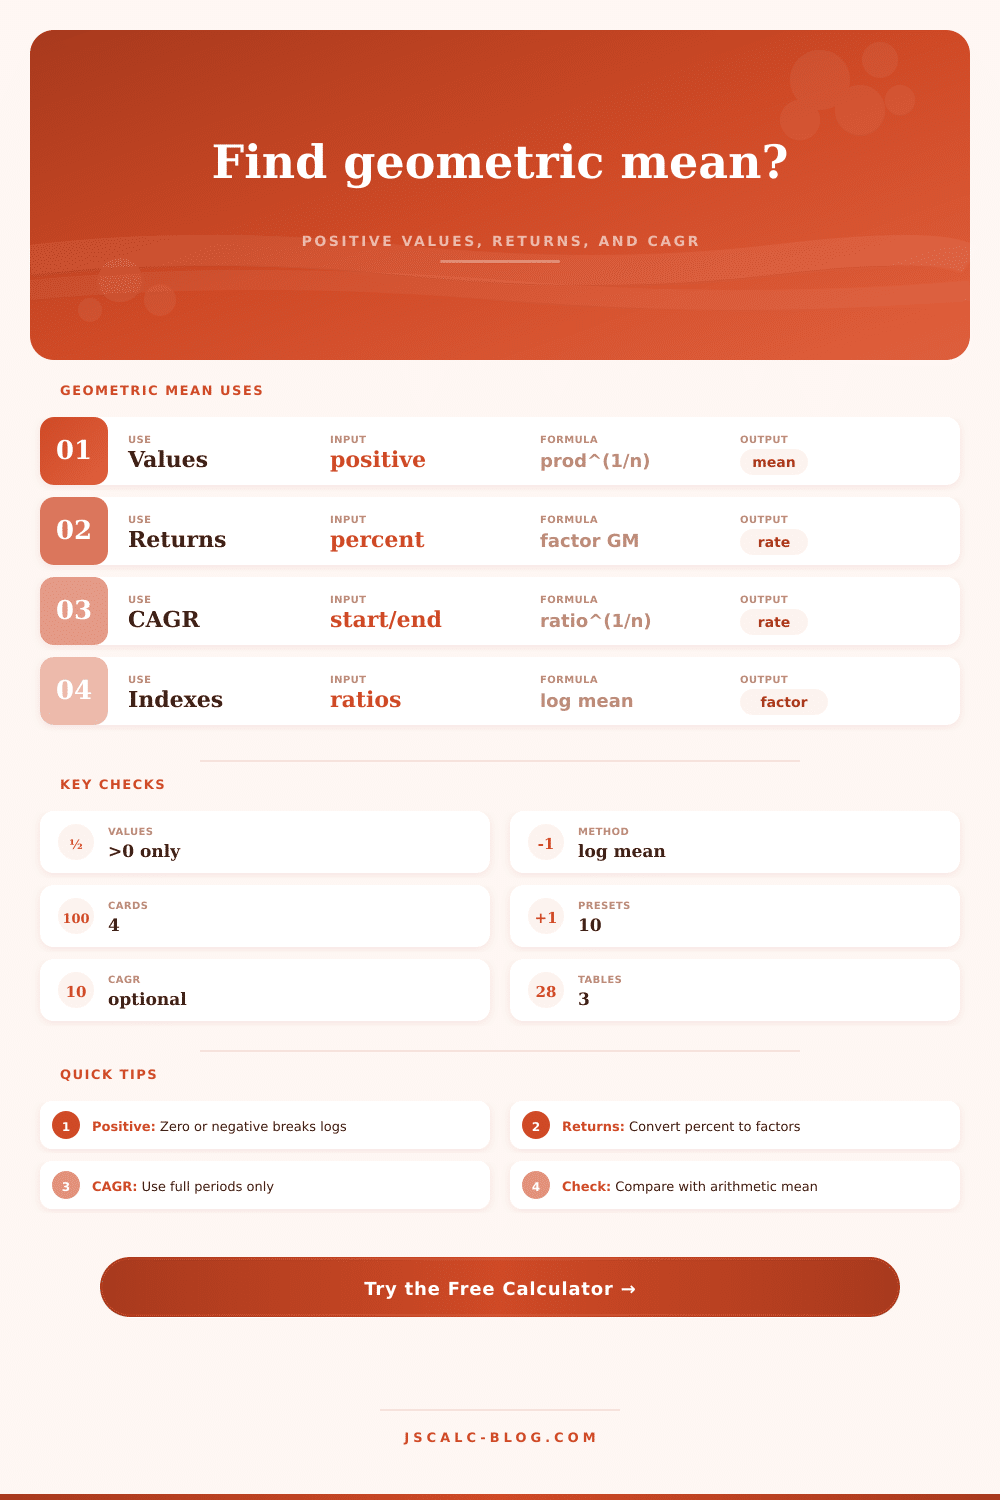
Find the geometric mean at JSCalc-Blog.com for positive data, multipliers, percent returns, or CAGR, with the product formula and stable log-method calculation shown side by side.
Choose a sample, then adjust the values or CAGR fields for your own data.
Geometric mean result
Enter positive values and calculate.
Separate entries with commas, spaces, semicolons, or new lines. Raw values and multipliers must be positive; percent returns must keep each factor above zero.
For percent returns, enter a percent target. For values or multipliers, enter a raw target.
| Value type | Input example | Internal factor | Primary result | Best use |
|---|---|---|---|---|
| Positive data values | 2, 8, 32 | same values | geometric mean value | ratios, sizes, indexes, normalized data |
| Growth multipliers | 1.08, 0.97, 1.12 | same multipliers | mean multiplier and rate | compound growth factors |
| Percent returns | 8, -3, 12 | 1 + return/100 | compound return percent | investment, traffic, revenue changes |
| Index levels | 98, 105, 111 | same positive levels | geometric center level | index-normalized comparisons |
| CAGR | start 50, end 84.5, n 5 | end/start ratio | annualized growth rate | multi-period start and end growth |
| Lab ratios | 0.5, 0.25, 0.125 | same positive ratios | central ratio | dilution or multiplicative steps |
| # | Original input | Positive factor | Natural log | Running log sum |
|---|---|---|---|---|
| Calculate to show the first 12 parsed values. | ||||
| Mean | Formula idea | Needs positive values? | Sensitive to extremes? | Use when |
|---|---|---|---|---|
| Geometric mean | multiply, then nth root | yes | moderate | changes compound or scale multiplicatively |
| Arithmetic mean | add, then divide | no | high | values combine additively |
| Harmonic mean | reciprocal average | yes for standard use | low values dominate | rates share the same numerator |
| CAGR | end/start nth root | start and end positive | ignores path | only beginning, ending, and periods are known |
| Median | middle ordered value | no | very low | you need a positional center, not compounding |
| Root mean square | square, average, root | no | very high | larger magnitudes should count more |
Say you invest in two things: one that returns double, and another that drops by half. Your gut reaction might be to conclude that you’re right back at square one. Sure, you had an arithmetic average of a 50 percent loss and a 100 percent gain, which sounds like a small profit. But your bank balance is less than what you started with.
When there’s compounding, arithmetic means mislead us. Geometric means tells the truth about how your money grew (or shrank) over time. It removes the mask of straight-line growth, and exposes slow-and-steady pace that would of achieved the same outcome.
Why Geometric Mean Is Better for Your Money
You can input your information into calculator up top, which does all of this arithmetic for you. And it prevents you from messing up, which is important, since doing arithmetic by hand can get pricey.
So why mess with the geometric mean? Why not just leave it at good old-fashioned addition? This happens because of volatility. As you may recall from high school statistics class, the geometric mean will always be lower than the arithmetic mean in finance. This is also true for any other situation where return vary greatly.
That’s to say: The further away your investment moves toward massive gains or losses, the bigger the distance between the average and the geometric mean becomes. Basically, the wider that chasm is, the riskier it is. And the closer those figures are together, the steadier your performance has been.
The reason is pretty obvious: Stability is valuable, but it isn’t captured by simple addition.
Understand the inputs. The calculator assumes certain types of multipliers (or positive values). Because log math doesn’t hold up when going below zero, you can’t just plug negatives straight into the calculator.
What about percentages? No problem. Behind the scenes, the calculator takes those percentage returns and turns them into growth factors. A 10% return equals a factor of 1.1; a 10% loss equals a factor of 0.9.
Why does it do this? It does this so it can calculate compounding properley. If it didn’t convert from percentages into growth factors, you’d end up summing percentages instead of multiplying growth factors, which won’t work at all. You’ll end up with a bunch of garbage.
Let the calculator do its thing converting for you, and pay attention to the trend instead.
And then there’s this thing called CAGR, which stands for compound annual growth rate. It’s a variation on the geometric mean. It addresses one particular question. Given an initial value, what steady yearly rate would be needed to reach a final value? In other words, given these two values and n years between them, what is the yearly rate that connects them all at once?
This works well when you need to smooth out a non-linear growth pattern. And it provides single number against which to measure other investments. But it doesn’t capture the route taken. It won’t show you the scary bumps along the way. It will simply tell you that you were somewhere else then you began.
Use it carefully. High annual growth rates can obscure a stomach-churning ride.
The calculator presents both methods: the log method and the direct product method. The latter can be unstable for big datasets; multiplying very large numbers exceeds bounds of most computers. The log method tends to be more stable for large data sets.
The problem is people tend to take a shortcut when they’re trying to average things, but forget to convert them into common unit before doing so. So, for example, the raw numbers may seem to average out in some way that makes sense. Maybe the dilution factor or index level looks decent. But if those aren’t absolute numbers, if they instead describe how things change, then you want the geometric thing.
The reference table on the page spells all this out. It lists what kind of input works with what kind of situation. Website session growth and lab dilution ratio, these both get treated in this way because they involve multiplication. One depends off another. And adding them up breaks this dependence; multiplying keeps it intact.
One other thing: beware the benchmark comparison. You can specify a target rate. It is good to see whether you are beating a standard like inflation or a bond index. Just don’t forget to apply same test to the benchmark. A geometric mean versus an arithmetic target? That’s a recipe for confusion. One measures something different than the other.
Yes, the geometric mean will be slower. However, it is also more honest. It represents the reality of compounding.
So ultimately, the geometric mean is all about perspective. It makes you think of growth in terms of process, not sum. It makes you remember that losses hurt more then gains help. You need a 100% gain to offset a 50% loss. Arithmetic mean doesn’t remember. The geometric mean supports you.
If you want to get a sense of how your data actualy grows, the geometric mean is your friend. Notice the difference between the two averages when looking at your results. That’s the story of your volatility. The other half is knowing what average to believe.
Know this: in the world of compounding, believe the one that multiplies. Because that’s the only one that honors the math behind growth.