Food Profit Margin Calculator
Turn a plate cost and menu price into food cost percentage, gross margin, gross profit per dish, and a target-based suggested menu price, with optional labor and overhead for prime cost.
🍽Real Menu Presets
📝Dish Inputs
Find % uses your menu price. Find price uses your target food cost %.
Total raw food cost to make one portion.
Used in find-food-cost-% mode.
Industry target is usually 28% to 35%.
Used to project batch profit for this dish.
Set to 0 to skip prime cost.
Rent, utilities, and other fixed share.
🔢Formula Snapshot
⚙Full Formula Breakdown
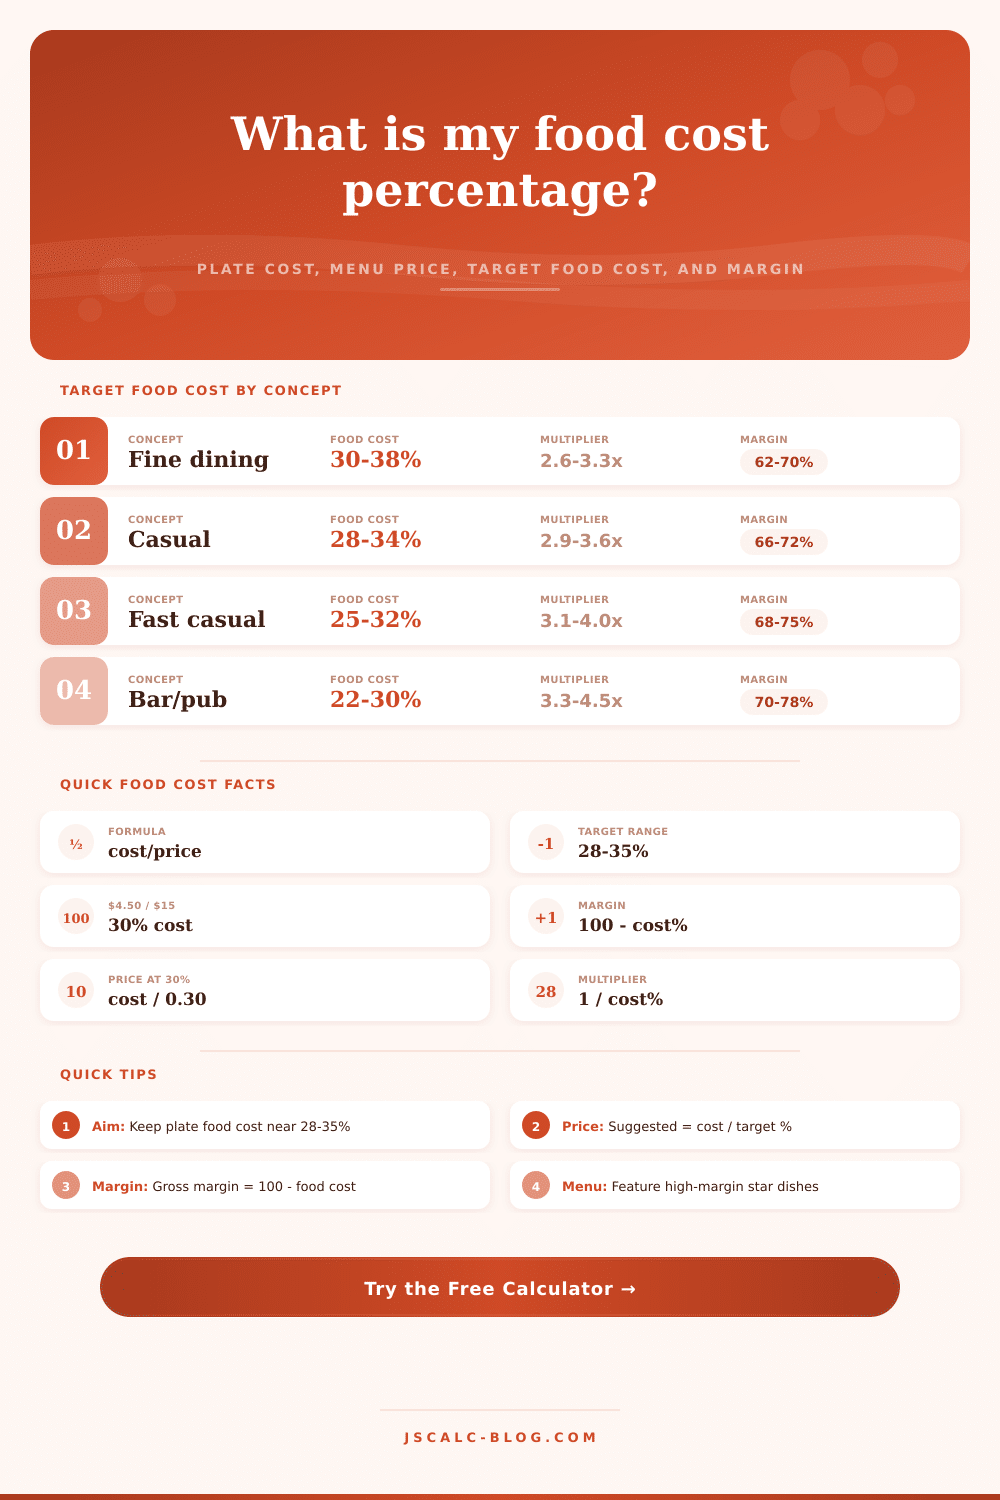
🏢Target Food Cost by Concept
| Restaurant Concept | Target Food Cost | Typical Multiplier | Gross Margin |
|---|---|---|---|
| Fine dining | 30% to 38% | 2.6× to 3.3× | 62% to 70% |
| Casual full service | 28% to 34% | 2.9× to 3.6× | 66% to 72% |
| Fast casual | 25% to 32% | 3.1× to 4.0× | 68% to 75% |
| Cafe and bakery | 25% to 33% | 3.0× to 4.0× | 67% to 75% |
| Pizzeria | 22% to 30% | 3.3× to 4.5× | 70% to 78% |
| Bar and pub food | 22% to 30% | 3.3× to 4.5× | 70% to 78% |
🗂Food Cost % to Pricing Multiplier
| Food Cost % | Multiplier | Gross Margin | Price on $5 Plate | Profit / Plate |
|---|---|---|---|---|
| 20% | 5.00× | 80% | $25.00 | $20.00 |
| 22% | 4.55× | 78% | $22.73 | $17.73 |
| 25% | 4.00× | 75% | $20.00 | $15.00 |
| 28% | 3.57× | 72% | $17.86 | $12.86 |
| 30% | 3.33× | 70% | $16.67 | $11.67 |
| 32% | 3.13× | 68% | $15.63 | $10.63 |
| 35% | 2.86× | 65% | $14.29 | $9.29 |
| 38% | 2.63× | 62% | $13.16 | $8.16 |
| 40% | 2.50× | 60% | $12.50 | $7.50 |
| 45% | 2.22× | 55% | $11.11 | $6.11 |
📊Menu Category Benchmarks
| Menu Category | Plate Cost Range | Target Food Cost | Typical Menu Price |
|---|---|---|---|
| Appetizers / starters | $1.50 to $4.00 | 26% to 32% | $7 to $14 |
| Soups and salads | $1.00 to $3.00 | 18% to 28% | $6 to $13 |
| Sandwiches / burgers | $2.50 to $5.00 | 28% to 34% | $9 to $17 |
| Pasta and pizza | $2.00 to $5.00 | 22% to 30% | $12 to $20 |
| Center-plate entrees | $5.00 to $12.00 | 30% to 38% | $18 to $38 |
| Desserts | $1.00 to $3.50 | 20% to 30% | $7 to $14 |
🧮Prime Cost Guide
| Cost Component | Healthy Share of Sales | Warning Zone | Notes |
|---|---|---|---|
| Food cost | 28% to 35% | Over 38% | Core of this calculator |
| Labor cost | 25% to 32% | Over 35% | Kitchen plus front of house |
| Prime cost (food + labor) | 55% to 65% | Over 68% | Watch this weekly |
| Overhead / occupancy | 12% to 20% | Over 24% | Rent, utilities, insurance |
| Net profit target | 6% to 12% | Under 3% | What remains after all costs |
💡Menu Pricing Tips
In kitchens, we talk about food cost as if it’s a percentage, and most people know they should care about it. But very few understands its impact until they see it in their paycheck. We all think that a dish is an item you purchase ingredients for and then mark up to sell. Reality is far more tenuous. There’s a margin between your raw ingredient costs and whatever price you list on the menu. And that margin needs to account for more than just food: for labour, utilities, rent, and your personal paycheque. Unless you’re tracking this margin, you’re gambling with someone else’s money.
Once you plug in your current menu price and plate cost, the rest is handled by calculator above; no more guessing. The key input: The total raw food cost for a single portion. This means that if you purchase an entire chicken but only use six ounces of breast meat per sandwich, the cost should of been calculated using the cost of the entire chicken… The cost of the entire chicken (meaning before you cut it up) rather than just the raw weight of the breast meat. It also accounts for any shrinkage from trim waste and every ounce of oil used to fry it.
Why You Must Track Your Food Costs
Ignoring shrinkage is what cause most amateurs to underestimate their cost. A couple points difference in your actual food cost percentage will change everything later on. What’s the actual cost of each plate? Now figure out what percentage of your revenue that number represent. Most full service concepts generally run in range of 28-35%, that’s industry standard. Fast casual typically aims lower to preserve volume. Fine dining might push higher due to more intense labor. Don’t feel obligated to commit all this data to memory; just know that anything north of 40% is an early warning flag. That’s when you’re seeing a gross margin of less than 60%, which leaves you with very few pennies to play with for error and/or overhead.
If you want to hit a specific target, the tool will suggest a new menu price. It won’t tell you whether the price on today’s menu is too high/low, only mathematical connection between revenue/cost. This information is important for menu engineering purposes: Not all dishes should weigh equally. While some things drive traffic (stars), others contribute significantly to your bottom line but only has tiny margins (cash cows). House-made breads, soups and pastas will almost always have great ratios; they’re cheap to make and easy to scale up. Train your servers to upsell these items and put them front-and-center on your menus. Basically, use those dishes with high margins to your advantage. You’ll be able to lower your average food cost without actually increasing prices for your customers. It’s a sneaky little move, but it’s far less heavy-handed than simply adding an extra two bucks onto everyone’s check.
This is why tracking prime cost is so important, it incorporates both your labor costs and your food costs. For example, if your food cost is 30% but your labor runs 35%, your prime cost is 65%. Your prime cost is 65% of sales. Now only 35 cents out of each dollar are left for rent, utilities, equipment depreciation, and profits. If any of these categories creep up, you’ll find yourself in a tight spot very soon. An extra shift of overtime or a little more waste than normal will gobble up the rest of that money. This will turn a profitable week into a break even week.
Ultimately, pricing is both an art and a science, part psychology, part arithmetic. While diners don’t often recognize subtle tweaks to keep food cost in check, they do take note if prices suddenly leap to oddball amounts. You want to price items so they seem fair for guests but also insulate the restaurant from unpredictable shifts in ingredient prices. Seasons can change produce costs, or market shifts can change protein costs. Something can change the bottom line overnight, so static prices are risky. Make sure you are always comparing your dishes to what suppliers currently charge, otherwise, you risk unknowingly subsidizing your own clientele with old menu prices.
Keeping track of these metrics isn’t an accounting class requirement, though it certainly takes some discipline. If you don’t know how much your food costs, you’ll be out of business because you’re guessing, and guessing is how restaurants fail. Knowing the cost breakdown of every item on your menu lets you control the largest variable cost. Those numbers describe waste, inefficiency and value. Understand the story and stop running around reacting to market fluctuations; instead, start intentionaly steering the boat. That’s where your real business lives (or doesn’t). It goes back to that one missing space on the menu: that gap between what you charge and what you spend.