Dropshipping Profit Margin Calculator
Find real net profit per order after product cost, inbound shipping, platform fees, payment processing, ad cost per order, and returns. See net margin, breakeven ROAS, and a full cost breakdown.
📦Real Store Presets
🛒Order Inputs
Set 0 for a free shipping offer.
Used when method is CPA per order.
Used when method is Target ROAS.
Used with orders below (spend / orders).
Refunded orders lose product and ad cost.
🔢Profit Snapshot
🏷Platform Fee Structures
| Channel | Platform Fee | Typical Payment | Notes |
|---|---|---|---|
| Shopify store | ~2% (no Shopify Payments) | 2.9% + $0.30 | 0% if using Shopify Payments |
| WooCommerce | 0% platform | 2.9% + $0.30 | Stripe or PayPal handles payment |
| Etsy | 6.5% transaction | 3.0% + $0.25 | Plus $0.20 listing fee |
| Amazon | ~15% referral | Included in referral | FBA fees extra if fulfilled |
| eBay | ~13.25% final value | Included + $0.30 | Category rate varies |
| TikTok Shop | ~8% commission | Included in commission | Promo periods may lower it |
📊Healthy Margin Benchmarks
| Net Margin | Rating | What It Means | Common For |
|---|---|---|---|
| Below 0% | Losing money | Ads or COGS too high | Untested products |
| 0% to 10% | Thin | One refund wipes profit | Low-ticket impulse buys |
| 10% to 20% | Workable | Scalable with volume | Competitive niches |
| 20% to 30% | Healthy | Room to test new ads | Mid-ticket general stores |
| 30% to 40% | Strong | Reinvest and grow fast | Unique or branded items |
| Above 40% | Excellent | High-margin winner | High-ticket, print on demand |
🎯Breakeven ROAS Guide
| Gross Margin Before Ads | Breakeven ROAS | Target ROAS (2.5x headroom) | Read |
|---|---|---|---|
| 20% of price | 5.00x | Very hard | Ads must be razor efficient |
| 30% of price | 3.33x | ~8.3x needed | Tight but possible |
| 40% of price | 2.50x | ~6.3x needed | Common dropship zone |
| 50% of price | 2.00x | ~5.0x needed | Comfortable to scale |
| 60% of price | 1.67x | ~4.2x needed | High-margin, easy ads |
| 70% of price | 1.43x | ~3.6x needed | Print on demand style |
🗂Price vs Cost Comparison Grid
| Selling Price | Product Cost | Ad Cost / Order | Net Profit | Net Margin | Breakeven ROAS |
|---|---|---|---|---|---|
| $15.00 | $5.00 | $4.00 | $4.66 | 31.1% | 1.73x |
| $20.00 | $6.00 | $6.00 | $5.32 | 26.6% | 1.77x |
| $30.00 | $8.00 | $6.00 | $11.93 | 39.8% | 1.50x |
| $45.00 | $12.00 | $10.00 | $19.16 | 42.6% | 1.52x |
| $50.00 | $18.00 | $12.50 | $16.15 | 32.3% | 1.72x |
| $65.00 | $22.00 | $15.00 | $24.32 | 37.4% | 1.56x |
| $90.00 | $30.00 | $25.00 | $30.19 | 33.5% | 1.63x |
| $120.00 | $45.00 | $30.00 | $40.42 | 33.7% | 1.60x |
Rows use no separate shipping charge, 3% platform, and 2.9% + $0.30 payment. Enter your own numbers above for an exact result.
⚙Full Formula Breakdown
📋Cost Breakdown Example
| Line Item | Basis | $30 Order Example | Effect On Profit |
|---|---|---|---|
| Selling price | Revenue in | +$30.00 | Starting point |
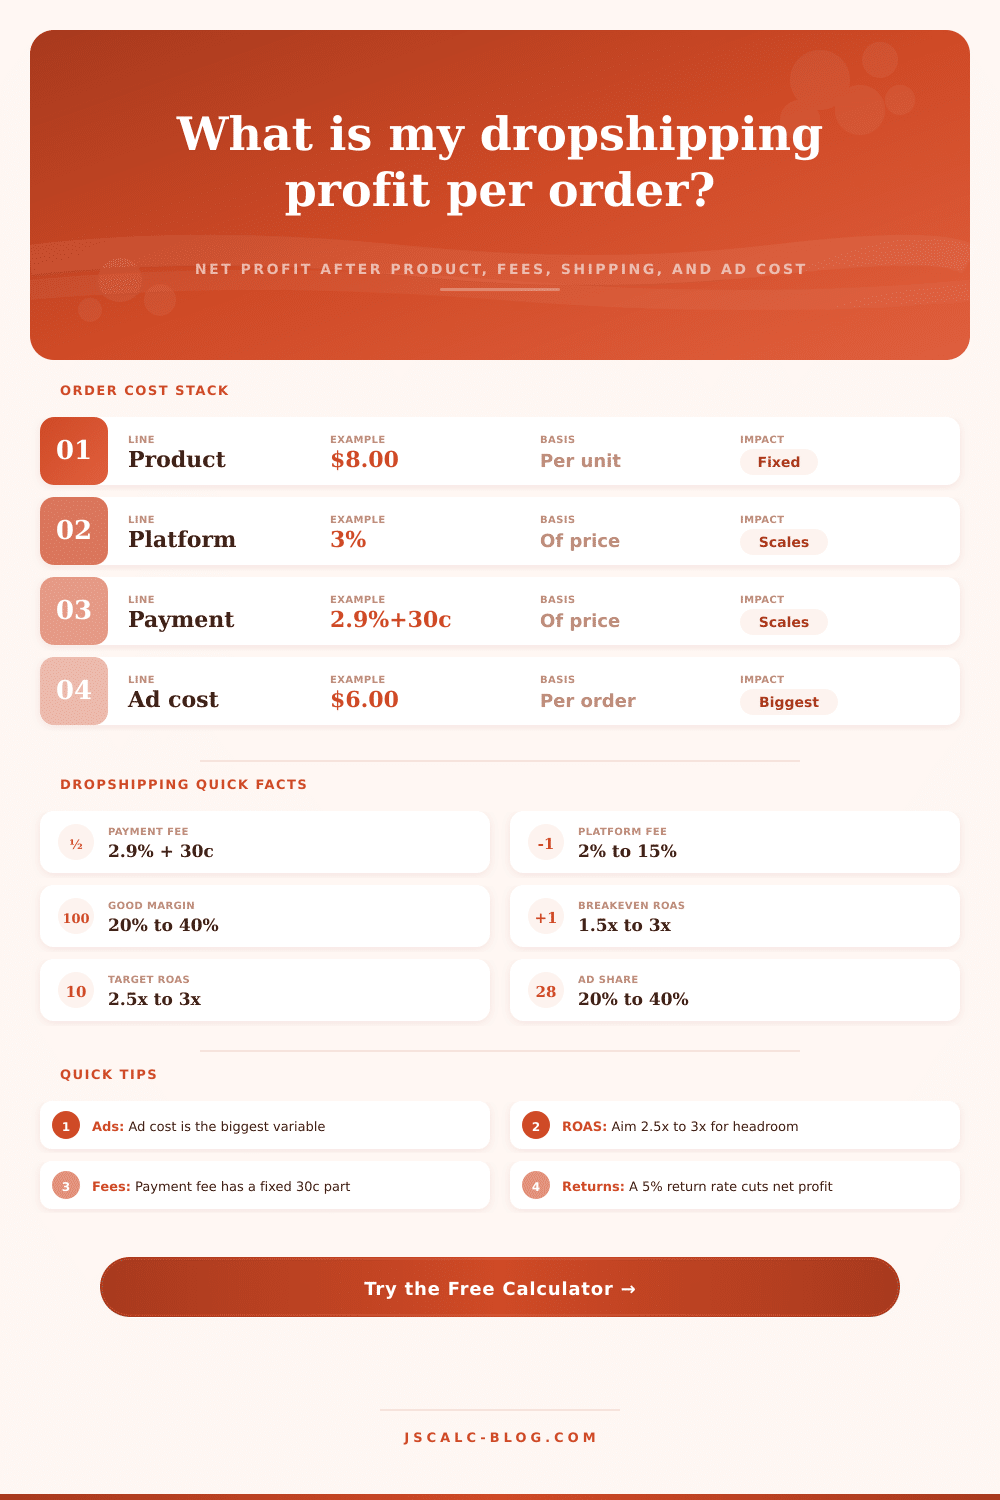
| Product cost | Per unit fixed | –$8.00 | Fixed regardless of price |
| Inbound shipping | Per unit fixed | –$4.00 | Fixed, often supplier ePacket |
| Platform fee | 3% of $30 | –$0.90 | Scales with price |
| Payment fee | 2.9% + $0.30 | –$1.17 | Has a fixed floor per order |
| Ad cost (CPA) | Per order | –$6.00 | Biggest and most variable |
| Net profit | What is left | =$9.93 | 33.1% net margin |
💡Practical Profit Tips
For many drop shippers, their journey start with this trap: They have an eight-dollar item on AliExpress and figure they’ll turn it around at thirty bucks. Sounds like a twenty-two dollar profit trap!
You can use twenty-two dollars to pay off your fees, your ads, or maybe even get new laptop. Seems like plenty! Except when the bills come in, that won’t even remotly light your house. That’s because the distance from that first rush of enthusiasm to seeing cash in your bank account is what kills most new stores.
Why You Lose Money in Dropshipping
Most of the time, you just fail to track small expenses that eat away at that twenty-two dollar margin. All of these little fees will cost you a ton. It is those pennies here or dollars there. You don’t notice them at checkout, but they are first place you lose money. When you’re running thin margins, the platform commission, the percentage taken by payment processor, and all of the other small fixed fee can pile up fast.
Maybe you think that one small fee of a couple of cents plus 2.9% per payment won’t be much on just one order. But then multiply that by five hundred orders per month and it will eats into your profits. The calculator above does this math for you so you aren’t left guessing if you’ve priced yourself out of business. Account for the payment gateway cut and the platform slice before you get excited about making some money.
The single biggest variable left in the equation is advertising. Once you’ve negotiated with your suppliers, the cost of your product is fairly consistent. Shipping rates doesn’t swing drastically up or down from one day to the next. But the cost of ad spend is volatile, and there’s no margin for error. One day, you might have six-dollar cost per acquisition (CPA), but then creative fatigue sets in or competition heats up, and suddenly you’re paying eight bucks instead. The margin that seemed healthy yesterday now doesn’t exist today.
To know where the danger zone exists, you need to know what your breakeven return on ad spend looks like. In other words, it will tell you precisely how many dollars in revenue you have to earn for every dollar you spend on advertising in order to break even. So if you operate right at this number, any incremental uptick in costs sends you into the red.
Many operators underestimate their return target. When your return target exactly equals your break even point, then you have nothing in the bank for any chargebacks, returns, unexpected spikes in your customer acquisition cost (and so on). Instead, shoot for far above your break-even point, which will provide some financial breathing room that can absorbs these types of shocks without killing your business. And if performance gets better, you’ll have leeway to go all out and grow the campaigns, instead of barely breaking even at $0/unit.
And then there is returns. Another sneaky way to kill yourself from the beginning is often forgotten in early estimates. Five percent returns sounds reasonable right? Until you think about how every one of those returned orders still ate up your product cost and ad spend. You used advertising dollars to get customer in the door. Then they sent the product back, and you lost out on whatever you paid for the goods.
If you factor in your estimated return rate as part of your adjustments, you’ll have a clearer idea of what you’ll be bringing home. Your rosy revenue prediction turns into some grounded cash flow expectation. One sale doesn’t prove strength of any dropship model. Volume does. Low volume conceals margin structure weakness. High volume exposes them.
Can you withstand a slight increase in shipping costs, or one policy tweak from any selling platform? If not, and if your net margin is <10%, you’ll lose all your money for the month with minimal warning. Develop some strength into the model by aiming higher on the margin scale so growth generates wealth instead of just increasing operating problems.
In conclusion: Dropshipping isn’t so much about locating the next viral product as it is about understanding your unit economics. Don’t fret over the supplier delays that anger your buyers or the algorithms that serve up your ad. Focus on prices you’ll charge and the costs you’re willing to incur. Run each order like its own little profit and loss statement, and go from guesswork to management.
This sheet below will help clarify these numbers, it’ll remove any illusions that this is easy money. It’ll remind you that profit isn’t just what you buy for minus what you sell for. It’s what’s left over, once everybody else takes a cut. And that leftover amount? That’s where the real business lies, and it deserves fierce protection.
You should of looked at these numbers earlier.