Fetal Weight Percentile Calculator
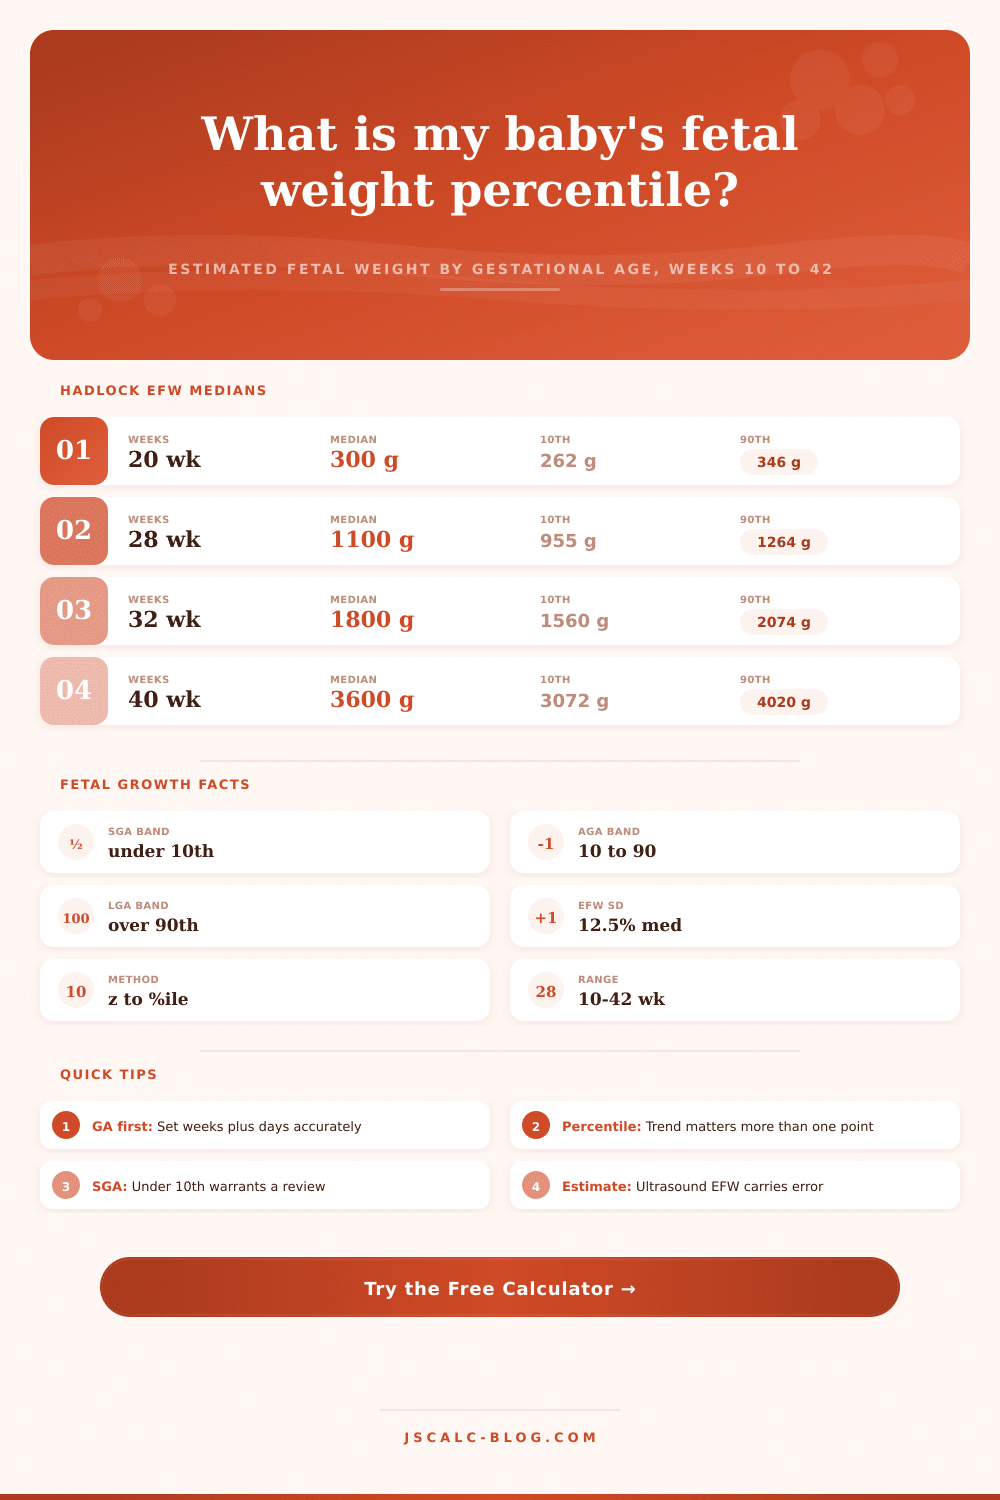
Estimate your baby's fetal weight percentile by gestational age using Hadlock-style reference medians and standard deviations. Enter the estimated fetal weight from ultrasound to see the SGA, AGA, or LGA band and a z-score, weeks 10 to 42.
🎯Gestational Age Presets
📝Pregnancy and Scan Inputs
Valid range is 10 to 42 weeks.
Days beyond completed weeks, for example 28+3.
Used when unit is grams.
Used when unit is pounds and ounces.
The ounces part of pounds and ounces.
Shifts the reference medians slightly.
Estimate only, not medical advice. Ultrasound EFW carries measurement error. Always consult your prenatal provider before drawing conclusions about growth.
🔢Method Snapshot
📊Hadlock-Style EFW Percentiles by Week
| Gestational Week | 10th (g) | Median 50th (g) | 90th (g) |
|---|---|---|---|
| 20 weeks | 262 | 300 | 346 |
| 24 weeks | 524 | 600 | 692 |
| 28 weeks | 955 | 1100 | 1264 |
| 32 weeks | 1560 | 1800 | 2074 |
| 36 weeks | 2296 | 2650 | 3054 |
| 40 weeks | 3072 | 3600 | 4020 |
| Your Reference Row | 10th | Median | 90th |
|---|---|---|---|
| Enter a gestational age above to see your interpolated reference row. | |||
🔗Percentile Band Interpretation
| Band | Percentile Range | Label | Common Meaning |
|---|---|---|---|
| Below 3rd | Under 3% | Severe SGA | Often prompts closer surveillance |
| 3rd to 10th | 3% to 10% | SGA | Small for gestational age |
| 10th to 50th | 10% to 50% | AGA (lower) | Appropriate, below the median |
| 50th to 90th | 50% to 90% | AGA (upper) | Appropriate, above the median |
| 90th to 97th | 90% to 97% | LGA | Large for gestational age |
| Above 97th | Over 97% | Severe LGA | May prompt review of factors |
📐Z-Score to Percentile Reference
| Z-Score | Percentile | Band | Reading |
|---|---|---|---|
| –2.00 | 2nd | Severe SGA | Well below median |
| –1.28 | 10th | SGA cutoff | Lower AGA border |
| –0.67 | 25th | AGA | Lower quartile |
| 0.00 | 50th | AGA | Exactly the median |
| +0.67 | 75th | AGA | Upper quartile |
| +1.28 | 90th | LGA cutoff | Upper AGA border |
| +2.00 | 98th | Severe LGA | Well above median |
⚖Grams to Pounds and Ounces Comparison Grid
| GA Week | Median (g) | Median (lb oz) | 10th (g) | 90th (g) | Milestone |
|---|---|---|---|---|---|
| 16 weeks | 146 | 0 lb 5 oz | 127 | 168 | Size of an avocado |
| 20 weeks | 300 | 0 lb 11 oz | 262 | 346 | Anatomy scan window |
| 24 weeks | 600 | 1 lb 5 oz | 524 | 692 | Viability threshold zone |
| 28 weeks | 1100 | 2 lb 7 oz | 955 | 1264 | Third trimester start |
| 32 weeks | 1800 | 3 lb 15 oz | 1560 | 2074 | Rapid weight gain |
| 34 weeks | 2200 | 4 lb 14 oz | 1900 | 2540 | Lungs maturing |
| 36 weeks | 2650 | 5 lb 13 oz | 2296 | 3054 | Late preterm border |
| 38 weeks | 3080 | 6 lb 13 oz | 2660 | 3540 | Early term |
| 40 weeks | 3600 | 7 lb 15 oz | 3072 | 4020 | Full term due window |
| 42 weeks | 3700 | 8 lb 2 oz | 3160 | 4180 | Post-term monitoring |
⚙Full Formula Breakdown
📋Reference Notes
| Item | Typical Value | How It Is Used | Effect on Percentile |
|---|---|---|---|
| Median M | From the GA table | Center of the reference | Sets the 50th percentile point |
| SD share | 11% to 14% | Width of the spread | Wider SD pulls percentiles toward 50th |
| Sex shift | About ±3% | Adjusts median M | Male raises, female lowers slightly |
| Ultrasound error | ±10% to 15% | Applies to the EFW input | Can move the percentile notably |
| Twin note | Per baby EFW | Flags discordance concept | Compares each twin separately |
💡Practical Fetal Growth Tips
⚠Important Disclaimer
All you hear are the sounds of the Doppler probe and monitor humming as the ultrasound tech takes measurements across your belly and baby’s head. And then there it is: A number with an accompanying percentile value. It shows estimated weight of your baby in grams or pounds. Like a report card for your pregnancy, the number can trigger panic if it isn’t somewhere smack dab in the middle.
But knowing what all that means can help ease some stress. Remember: This isn’t about actual weight; it’s about size (relative size). Three pounds at twenty weeks may sound small, and it is small compared to an average newborn. But it’s not small relative to normal range for a baby of that age, i.e., the median of all pregnancies at that point in time.
Understanding Your Baby’s Weight Percentile
When you plug in your numbers and dates on calculator, it do the math for you. Basically, it takes your raw number of grams and then compares it with growth curve based off other babies’ weights. That tells you how your baby ranks compared to others who is at the same developmental stage. The calculation depend on gestational age, which means you have to be accurately dated. A week difference in the due date make a big difference in the median weight. In fact, it’s especially big in the third trimester, when babies pack on pounds fast. A miscalculation of gestation can result in an otherwise perfectly normal baby being labeled as small (or large) for his/her age.
To tweak this estimate, the tool factor in days after completed weeks. So you input your reported weight, and the computer will return expected median at that point. After calculating your percentile, you will be placed into one of three categories: appropriate for gestational age (between the 10th and 90th percentile). This include most healthy babies. Small for gestational age (below the 10th percentile). Big for gestational age (above the 90th).
These aren’t diagnoses, just descriptive terms of where your baby’s weight fall on a spectrum relative to her size at this stage in pregnancy. They signal that there may be something worth keeping an eye on, but don’t imply anything is wrong with either the baby or mother. Ultrasound measurements has a big margin of error. It’s an approximation that is based on your baby’s measurements, their abdominal diameter, their head circumference and so forth. Scans have been found in studies to be off by as much as ten to fifteen percent of real weight.
It’s possible that a baby who looks small in utero will turn out to be average at birth. That’s why it’s not just about any given data point, but also about trends. If the growth curve is steady on whatever line you’re on (whether 10th or 90th), that’s reassuring. There are no single numbers from a single scan that doctors fixate on; they’re looking for patterns over time.
Some of this is biological too: male babies have been found on average to weigh a bit more then female babies in utero. Population reference data differ. You can adjust for growth standards and sex via the calculator. The algorithm use a so-called z-score that indicates by how many standard deviations above or below the mean (the median) your baby lies. That is a more refined way of looking at things than just cut-offs based off statistics.
Don’t mistake these for a replacement for medical experience… They’re an extension of it, aiding discussion with your provider. They can assists in questioning what’s normal and how to monitor what’s not. But they don’t record your mom-health history (or the function of your placenta). Instead, they aim to give you perspective when you’re monitoring your pregnancy.
Know then that that percentile number represent one moment in time. It is a snapshot of where the baby is today, but the complete story of their growth will be the picture. Verify your dates. Trust the process. Let the trends guide your peace of mind more than any given data point.