Fetal Percentile Calculator
Estimate percentile and z-score for estimated fetal weight, biparietal diameter, femur length, or abdominal circumference by gestational age using reference median and standard deviation curves. Informational estimate, not medical advice.
🎯Real Scan Presets
📝Scan Inputs
Weight in grams; BPD, FL, and AC in millimeters.
Used only when SD source is custom.
Informational estimate only, not medical advice or a diagnosis. Ultrasound percentiles vary by reference chart, dating accuracy, and sonographer technique. Always confirm growth with your obstetric provider.
🔢Method Snapshot
📊Median & 10th / 90th By Week
| GA Week | EFW Median (g) | EFW 10th | EFW 90th | BPD Median (mm) | FL Median (mm) | AC Median (mm) |
|---|---|---|---|---|---|---|
| Enter values above to build the reference table. | ||||||
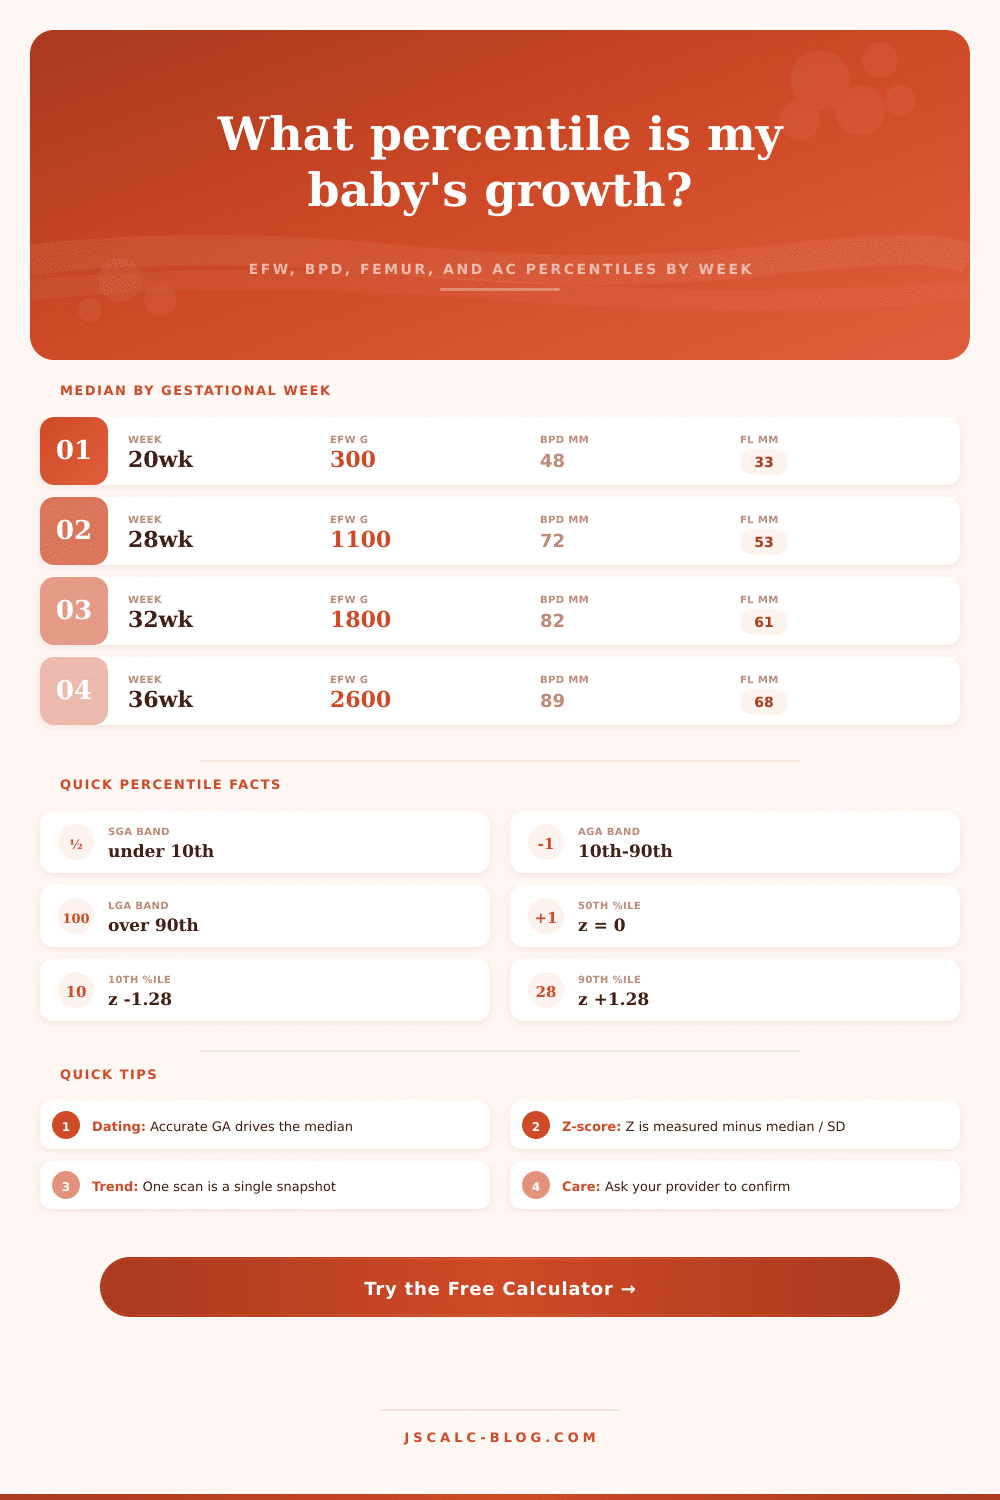
10th and 90th columns use z of –1.28 and +1.28 around the EFW median and reference SD; other measures follow the same rule internally.
📈Percentile Band Interpretation
| Percentile Band | Approx Z Range | Common Label | General Reading | Typical Next Step |
|---|---|---|---|---|
| Under 3rd | Below –1.88 | Very small | Well below median | Provider review of growth |
| 3rd to 10th | –1.88 to –1.28 | Small (SGA) | Lower size range | May repeat growth scan |
| 10th to 25th | –1.28 to –0.67 | Low normal | Below average, common | Routine follow-up |
| 25th to 75th | –0.67 to +0.67 | Average (AGA) | Middle of the curve | Routine schedule |
| 75th to 90th | +0.67 to +1.28 | High normal | Above average, common | Routine follow-up |
| 90th to 97th | +1.28 to +1.88 | Large (LGA) | Upper size range | May repeat growth scan |
| Over 97th | Above +1.88 | Very large | Well above median | Provider review of growth |
🔗Z-Score To Percentile Map
| Z-Score | Percentile | Z-Score | Percentile | Z-Score | Percentile |
|---|---|---|---|---|---|
| –2.00 | 2.3 | –0.50 | 30.9 | +1.00 | 84.1 |
| –1.88 | 3.0 | –0.25 | 40.1 | +1.28 | 90.0 |
| –1.65 | 5.0 | 0.00 | 50.0 | +1.65 | 95.0 |
| –1.28 | 10.0 | +0.25 | 59.9 | +1.88 | 97.0 |
| –1.00 | 15.9 | +0.50 | 69.1 | +2.00 | 97.7 |
| –0.67 | 25.1 | +0.67 | 74.9 | +2.33 | 99.0 |
📏Measurement Reference & Comparison
| Measure | Full Name | Units | 20wk Median | 28wk Median | 32wk Median | 36wk Median |
|---|---|---|---|---|---|---|
| EFW | Estimated fetal weight | grams | 300 | 1100 | 1800 | 2600 |
| BPD | Biparietal diameter | mm | 48 | 72 | 82 | 89 |
| FL | Femur length | mm | 33 | 53 | 61 | 68 |
| AC | Abdominal circumference | mm | 150 | 245 | 285 | 322 |
| EFW SD | Approx spread | grams | 40 | 135 | 220 | 320 |
| BPD SD | Approx spread | mm | 3.0 | 4.2 | 4.8 | 5.4 |
⚙Full Formula Breakdown
📋Reference Values
| Item | Common Entry | How It Is Used | Percentile Effect |
|---|---|---|---|
| Gestational age | 14 to 42 weeks | Selects median and SD | Shifts the whole reference curve |
| Measured value | Grams or mm | Numerator of the z-score | Higher value raises the percentile |
| Standard deviation | Reference or custom | Denominator of the z-score | Larger SD pulls percentile toward 50th |
| Small / large band | 10th, 5th, or 3rd | Sets SGA and LGA cutoffs | Changes the category label only |
| Rounding | Whole to two decimals | Display of percentile | No effect on the underlying z |
💡Practical Percentile Tips
In a darkened room, the technician rolls the transducer over your belly and the ultrasound machine do its thing. Measurement bars pop up onto the screen and it freezes on the baby’s profile. Head circumference. Femur length. It measure abdominal girth. And then the technician input all of these numbers into a computer that spits out a number: a percentile. Will the baby be big or small? You want to know that everything is okay. And so you anxiousy wait for the answer.
This is what pregnancy care today makes us anxious about. Percentile means It is not a grade on a report card; rather, it show where your baby falls in the statistical distribution of other babies at his/her gestation. If your baby are at the 50th percentile he/she is median; half of all babies will be bigger/smaller at the same week of their gestation. This do not mean that it is perfect. If he/she is in the 10th percentile then 9/10 of the other babies is larger then him/her at this precise moment. If you look at that as competition, it sound scary. In medical terms it is simply a description of normal variation.
Understanding Your Baby’s Ultrasound Measurements
After you plug in your personal measurements to the calculator above, it will crunch the numbers and output a z-score, which show how far your size is from the average. The mean (or average) are represented by a z-score of zero, so anything positive shifts right toward larger sizes and anything negative shift left toward smaller sizes. This distance allow us to take the emotion out of the data; we’re not measuring ourselves against some random ideal anymore, but instead we’re measuring ourselves up against bell curve.
All of these calculations hinge on accurate dating. Even if you’re off one week on your due date estimate, it move the whole reference chart. It could mean that a baby who looks small for age at 28 weeks may simply be average size for 30 weeks. And that makes all the difference in how it’s seen by doctors. Early ultrasounds, done during the first trimester, is much more accurate than ultrasounds later in pregnancy. Many providers count on an early scan to nail down the timeline. They don’t sweat the position of the baby relative to the growth curve until they have anchor date locked down.
The biparietal diameter measure head growth. Nutritional Status & Liver Size: Abdominal circumference Skeletal Development: Femur length Abnormalities in any of these measures can alert you that something is not right underneath the surface. For example, symmetrical growth restriction mean all are affected equally. Asymmetry is more suggestive of placental insufficiency, i.e., bone/brain are less affected then the belly/trunk. Each measurement can be viewed separately to determine whether any fall behind the rest. Separating them out eliminate the tendency to lump separate concerns into a single blanket diagnosis.
No one scan as important as the serial scans. If a baby remain at or around the 10th percentile for the past three months, he’s probably just constitutionally small. Usually that’s nothing to worry about if all of his markers is fine. But if a baby has been in the 50th and suddenly slide into the 10th within a month, it raise some red flags. If there’s crossing major percentile, it means we’re not talking about plain old genetics, we’re talking about something actively restricting growth. This is when your provider will start tracking this.
Knowing where the numbers come from can help explain them. The 10th and 90th percentile are a handy range that bracket the middle, the average (with most healthy fetuses in-between). Numbers below the 3rd or above the 97th is usually flagged for more scrutiny because they represent extreme values (and therefore greater risk of complications during labor and/or newborn adaptation). While not strict boundaries between health and disease, these cut-offs reflect statistical norms.
Keep in mind, however, that there is always some amount of error with an ultrasound measurement. Fetal positioning, maternal body shape, and even the angle at which the sonographer views your baby contribute to variability in the measurement. You should of focused on the bigger picture instead. Don’t get too hung up on slight changes. They inform the careful observer but don’t make decisions. Leave it up to your care team to read them in their complete clinical setting. It’s all about making sure you get that healthy baby no matter what side of the bell curve he or she lands on.