MACRS Depreciation Calculator
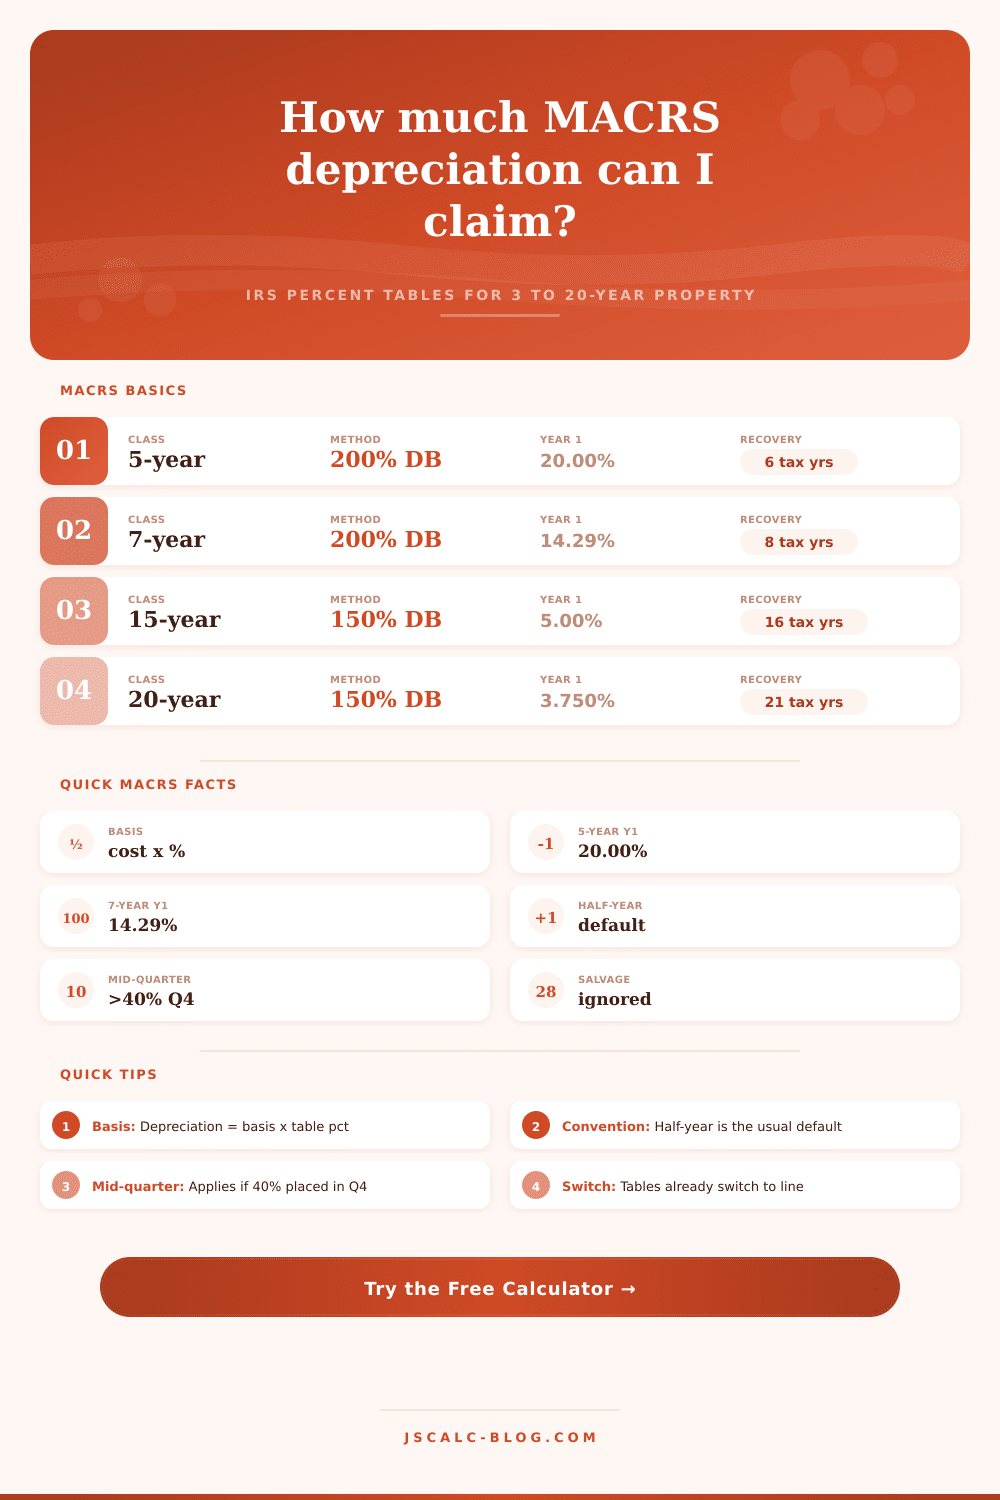
Build a full IRS MACRS tax depreciation schedule for 3, 5, 7, 10, 15, and 20-year property using the official percentage tables, the half-year and mid-quarter conventions, and 200% or 150% declining balance with the built-in switch to straight line.
🎯Real MACRS Presets
📝Asset And Method Inputs
Cost minus any Section 179 or bonus already taken.
Default is 200% DB for 3 to 10-year, 150% DB for 15 and 20-year.
Used only when the mid-quarter convention applies.
Recovery year number, where year 1 is the first tax year.
Optional. Estimates the cash tax benefit of the deduction.
🔢Schedule Snapshot
📊Full MACRS Depreciation Schedule
| Tax Year | MACRS % | Depreciation | Accumulated | Book Value |
|---|---|---|---|---|
| Enter values above to generate the depreciation schedule. | ||||
📐MACRS Percentage Table Reference
| Year | 3-Year | 5-Year | 7-Year | 10-Year |
|---|---|---|---|---|
| 1 | 33.33% | 20.00% | 14.29% | 10.00% |
| 2 | 44.45% | 32.00% | 24.49% | 18.00% |
| 3 | 14.81% | 19.20% | 17.49% | 14.40% |
| 4 | 7.41% | 11.52% | 12.49% | 11.52% |
| 5 | – | 11.52% | 8.93% | 9.22% |
| 6 | – | 5.76% | 8.92% | 7.37% |
| 7 | – | – | 8.93% | 6.55% |
| 8 | – | – | 4.46% | 6.55% |
| 9 | – | – | – | 6.56% |
| 10 | – | – | – | 6.55% |
| 11 | – | – | – | 3.28% |
| Year | 15-Year (150% DB) | 20-Year (150% DB) |
|---|---|---|
| 1 | 5.00% | 3.750% |
| 2 | 9.50% | 7.219% |
| 3 | 8.55% | 6.677% |
| 4 | 7.70% | 6.177% |
| 5 | 6.93% | 5.713% |
| 6 | 6.23% | 5.285% |
| 7 | 5.90% | 4.888% |
| 8–16 | 5.90% / 5.91% then 2.95% | 4.522% then 4.461% / 4.462% |
| 17–21 | – | 4.461% / 4.462% then 2.231% |
🗂Property Class Examples
| Class | GDS Method | Year 1 Rate | Common Assets |
|---|---|---|---|
| 3-year | 200% DB | 33.33% | Tractors, some tools, breeding hogs |
| 5-year | 200% DB | 20.00% | Autos, trucks, computers, office tech |
| 7-year | 200% DB | 14.29% | Office furniture, machinery, fixtures |
| 10-year | 200% DB | 10.00% | Water vessels, single-purpose ag structures |
| 15-year | 150% DB | 5.00% | Land improvements, roads, fences, restaurants |
| 20-year | 150% DB | 3.750% | Farm buildings, municipal utility lines |
⚙Convention And Method Comparison
| Rule | Half-Year | Mid-Quarter Q1 | Mid-Quarter Q4 | When It Applies |
|---|---|---|---|---|
| 5-yr Year 1 | 20.00% | 35.00% | 5.00% | Timing of first tax year |
| 7-yr Year 1 | 14.29% | 25.00% | 3.57% | Timing of first tax year |
| First-year assumption | Half a year | Middle of Q1 | Middle of Q4 | Deemed placed in service |
| Recovery years | Class + 1 | Class + 1 | Class + 1 | Extra part year at end |
| Trigger | Default | >40% in Q4 | >40% in Q4 | Last-quarter test |
| 200% vs 150% | Both allowed | Both allowed | Both allowed | Method election or class |
🧮Full Formula Breakdown
📋MACRS Reference Values
| Item | Typical Setting | How It Is Used | Effect On Schedule |
|---|---|---|---|
| Basis | Full purchase cost | Multiplied by each year percent | Scales every year of the table |
| Property class | 5 or 7-year | Selects which percent table | Sets number of tax years |
| Convention | Half-year default | Chooses first-year timing | Changes year 1 and last year |
| Method | 200% or 150% DB | Front-loads the deductions | Larger early-year write-offs |
| Salvage value | Not used | Ignored under MACRS | Basis fully depreciates to zero |
💡Practical MACRS Tips
It’s time to make another cash-flow decision. You’ve bought a $40,000 work truck. What do you do with it? To answer this question, you’ll refer to MACRS, the IRS depreciation rules. They’re pre-approved shortcuts for deducting the cost of business assets. At first glance, they feels like red tape bureaucracy. But these rules aren’t designed so you create complex formulas from scratch. Rather, they gives you a percentage table. Pick a class. Choose a convention. Multiply by the basis. That’s it: A messy reality becomes a clean spreadsheet row.
Asset class matter (what depreciation schedule applies to the asset). That’s the first thing to nail down correctly. Most small business assets falls into one of two classes: five year property (office equipment, trucks, computers etc.) or seven year property (general machinery, furnitures). There’s no negotiation here, these classes is set in stone by law. Your task is to shove your asset into the box they provide. Once you choose the proper class, the calculator do the rest. Since it knows the specific IRS percentages for each recovery period, it will pull those numbers directly from the system instead of making you track down a different revenue procedure. Match the tool to what you purchased, it’s that simple.
Understanding Depreciation Rules for Business Assets
This is where things can get tricky, tripping people up, the convention. By default, the assumption is known as the half-year convention, which means the IRS assume you put everything in service precisely halfway into tax year (even though you might’ve purchased something in November rather than January). That makes everyone’s life much easier. But if at least 40 percent of your cumulative acquisitions occur during the last quarter, then that safety net dissapears and you’ll need to move to the mid-quarter convention for all assets placed in service during the year. The purpose of this is to prevent taxpayers from hurrying their purchases into December to claim a larger first-year deduction under the half-year assumption. The software tool automatically adjust the rates based off this selection; no need to fret over accidentally applying incorrect quarter multiplier.
But what’s under those options? That’s where the depreciation method matters. The default option for most properties are 200 percent declining balance. This front-loads your deductions, meaning you get larger write-offs early on when the asset is the most productive and new. For longer-lived property such as farm buildings or land improvements, the method switch to 150 percent declining balance. Within these tables, there is an automatic switch to straight-line depreciation in the year that yield the greater deduction (you’ll never need to calculate this crossover point yourself). This makes a big difference to long-term planning because it guarantees that you squeeze every available dollar of value out of the asset before it fully writes off.
Another simplification (relative to previous accounting standards) is that MACRS doesn’t take salvage value into account whatsoever. Just assume that you’re deprecating the full basis down to nothing during the statutory time period. Of course, if you go on to sell it for something greater than its adjusted basis, that’s an ordinary income recapture, but we’ll discuss that separately some other day. Right now, just track how much of the purchase price you can write off in a given year.
In return, you get a clear view of total accumulated annual depreciation. You can also see its running total and the corresponding book value at any given point in time. If you take a look, you’ll see that a five-year prop actually covers six tax years because the half-year rule applies at both the beginning and end. This means your deductions will be slightly more spread out then the class label, precisely as they’re supposed to be under today’s rules. The way this all shakes out can make a big difference to how well you understand the cash flow implications, no more guessing based off vague approximations.
If you compare the total picture of a schedule over the years, you’ll notice how the wear and tear of your investment declines on paper each year. The deduction tapers off as your book value drop towards zero, there’s something nice about seeing that curve come together. The numbers tells a story of time and usefulness. You anticipated this cost ahead of time, and now you’re getting the tax advantage gradually over the lifespan of the item.
After all, that’s what depreciation does; it aligns cost with revenue, allowing your books to remain accuratey and sensible without requiring you to do advanced calculus quarterly. You should of looked at the numbers before buying.