Expected Value Calculator
Compute expected value, variance, standard deviation, net EV after optional costs, and a side-by-side decision comparison from outcome probabilities.
Set to 0 when your outcome values are already net results.
Net EV subtracts this value once from the gross EV.
0 compares pure EV; 0.10 subtracts 10% of standard deviation.
One outcome per line. Example: Win 250, 250, 9. Negative values are allowed.
Leave a sure thing as one line with probability 100 percent, 1.0 decimal, or any positive weight.
| Option | Outcome | Value x | Probability p | x times p | Variance contribution |
|---|---|---|---|---|---|
| Calculate to see each outcome contribution. | |||||
| Decision | Gross EV | Cost | Net EV | Variance | Std. dev. | Certainty equivalent |
|---|---|---|---|---|---|---|
| Calculate to compare Option A and Option B. | ||||||
| Penalty | Option A CE | Option B CE | Preferred choice | CE gap |
|---|---|---|---|---|
| Calculate to see how risk aversion changes the decision. | ||||
| Step | Formula | What it means | When to use it |
|---|---|---|---|
| Normalize probability | p_i = input_i / total input | Converts percent, decimals, or weights into probabilities that sum to 1. | Use whenever probabilities do not already sum exactly to 1. |
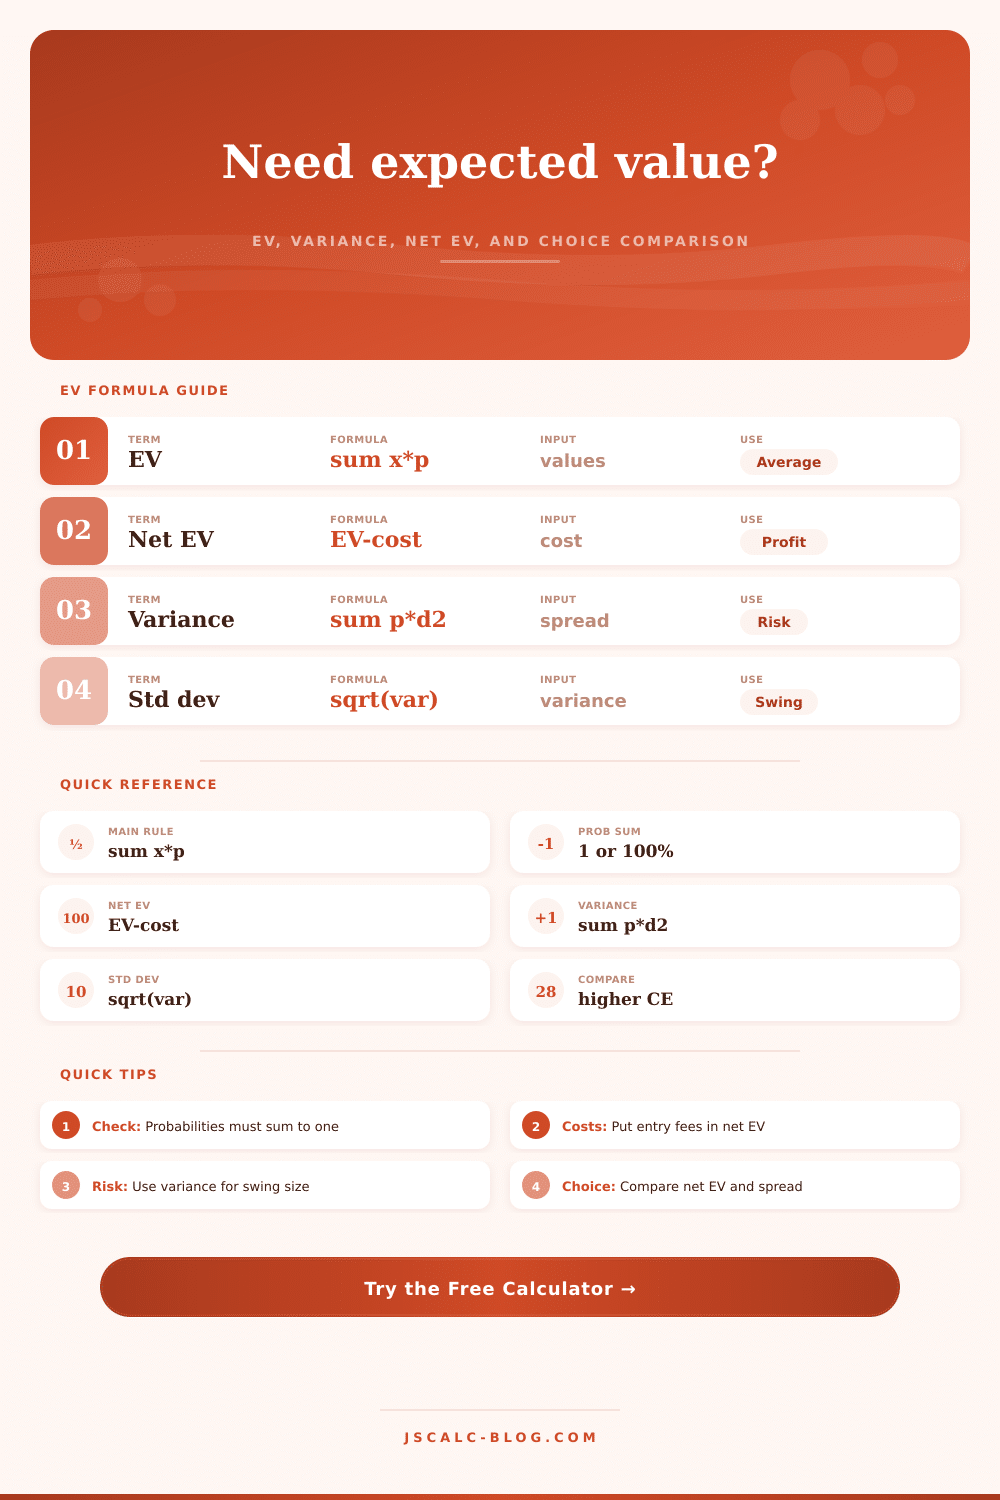
| Expected value | EV = sum x_i p_i | Long-run average outcome if the same uncertain decision repeats many times. | Use for raffles, bids, tests, launches, investments, and any discrete payoff tree. |
| Net expected value | Net EV = EV - cost | Subtracts an entry fee, premium, bid cost, or other sure cost from the gross EV. | Use when the cost is paid once no matter which outcome happens. |
| Variance | Variance = sum p_i(x_i - EV)^2 | Measures how spread out the outcomes are around the expected value. | Use to distinguish a steady choice from a high-swing choice with similar EV. |
| Certainty equivalent | CE = Net EV - k x standard deviation | A simple risk-adjusted score; k is your chosen penalty per unit of spread. | Use as a practical tie-breaker when variance matters to the decision maker. |
Compare prize EV against entry cost and see whether the ticket is positive or negative EV.
Combine win probability, delivery margin, and loss cases before choosing a proposal.
Weight weak, base, strong, and breakout outcomes to judge the average product result.
Compare rollout, holdback, or experiment options using net EV and risk spread.
Place premium cost beside claim probabilities to see the expected monetary tradeoff.
| Situation | Typical outcomes | Probability source | Cost handling | Decision metric |
|---|---|---|---|---|
| Lottery or raffle | Lose, small prize, major prize | Published odds or ticket counts | Ticket price as upfront cost | Net EV and entertainment value |
| Warranty purchase | No repair, small repair, large repair | Failure rates or historical claims | Warranty premium as cost | Expected savings versus premium |
| Contract bid | No win, break-even, target margin, overrun | Sales pipeline and delivery history | Bid prep cost as cost | Net EV and downside exposure |
| Inventory order | Stockout, normal sale, markdown, spoilage | Demand forecast weights | Order cost inside outcome values | Net EV and standard deviation |
| Product launch | Flop, modest, base, hit | Market research scenarios | Launch spend as upfront cost | Risk-adjusted CE |
| Investment | Loss, flat, base return, upside | Scenario model probabilities | Capital at risk in outcome values | Net EV with variance review |
| Game strategy | Miss, partial, normal win, bonus win | Rules or observed frequencies | Stake as upfront cost | Net EV per play |
| Credit decision | Default, late pay, normal pay, early pay | Score bands and portfolio data | Origination cost as cost | Net EV after losses |
What about expected value? That’s where we measure how much headline prize over- or underpays compared with real-world average. Yes, we know that headline number of yours. But the numbers tell us: On average, you’ll lose.
Expected value doesn’t predict one specific outcome. It predicts the average outcome if you made this same choice repeatedly. Why? Because most people zoom in on best-case scenario, which tickles our brain but confuses our wallet.
How to Use Expected Value
What are we realy measuring here? To test anything, just write out all possible results and their probability of occurring. Then assign a dollar amount to that result, weighted by the odds. The calculator do the arithmetic for you. It spits out what’s called a gross expected value… The raw average before you subtract any upfront costs.
If it’s positive, it’s working in your favor on balance. If not, you’re paying to have a possibility of winning, this is why casinos survives. This is also where many people fail initially: confusing net with gross.
It’s possible to have high expected value but catastrophic swings. Consider investing in a startup. Sure, the average return on all investments may be decent, but yours might go belly up without any liquidity at all. That’s what variance measures; how much those outcomes are spread out from average. Low variance result in steady returns, whereas high variance produce wild swings.
Before pursuing upside you must know if you can stomach the downside. To do this, the tool computes standard deviation, the square root of variance. Standard deviation provide a number you can read, telling you how far off the average a typical outcome will fall.
Two options could have same expected value, yet one is boring (a bond) while the other are volatile (a crypto token). For comparing such pair, we need something beyond just looking at the max. That’s why I subtract a penalty from every unit of standard deviation: it represents your own unique willingness to tolerate uncertainty. Raise the penalty if you’re conservative. Volatility drops by definition, which lowers that score. By forcing you to consider this tension, the reference table on the page, ranging from raffles to insurance, asks: Is the potential additional gain worth an additional unit of stress?
In the real world. It applies to everything from evaluating warranties to bidding on a business contract. The premium will be more expensive then the probable cost to repair. But if the item is unlikely to need repair, or if the repair is cheap, buying the warranty will actualy result in a loss. You’re paying for insurance… not necessarily for increased financial efficiency, but for peace of mind.
Sunk costs exist here too. When you bid on a job, you has to include the cost to prepare that job, not just the possible profit. And people ignore those sunk costs and chase their losses trying to break even. With this calculator, you can also enter those upfront fees as a separate number. Your net number is the real bottom line.
Don’t be intimidated by the number of decimal points. The models are only as accurate as your estimations of probability. Your estimated value for something is nothing more than a confident guess if your estimate of likelihood was wrong. Try to use historical data when available (or at least stress test your assumptions). Vary the probabilities a bit and see which model comes out ahead. If switching one parameter change the outcome, then your decision is weak, and leans too heavy upon shaky inputs.
To conclude. Expected value is a tool for clarity. It takes away fear and hope so you can see the math behind your decisions. The future is unknowable, but you can figure out which option leads to the best odds.
Let the numbers tell you what to do, then keep in mind that reality often have variables that no formula can predict. But it’s still better to have a baseline than no baseline at all. And don’t mistake the map for the territory.