Cost Per Mille Calculator
Measure the cost for every 1,000 ad impressions and connect it to viewability, clicks, conversions, revenue, and reach. Use served impressions for basic CPM or adjust for invalid traffic and viewable inventory for cleaner media comparisons.
🎯Campaign Presets
🧮CPM Inputs
Channel sets benchmark context and an expected viewability reference.
Objective changes the outcome reading in the result breakdown.
Choose which impression count should drive the primary CPM card.
This reduces served impressions before adjusted CPM is calculated.
Enter the total spend for the campaign or placement being measured.
Total ad impressions delivered before quality adjustments.
Use ad-server or verification viewability rate from 1 to 100.
Used to estimate unique reach from delivered impressions.
Optional, but needed for CTR and CPC output cards.
Optional outcome count for CPA and conversion rate.
Optional revenue total for ROAS and return per 1,000 impressions.
Compare actual CPM against your target or planned media benchmark.
🔢Current Campaign Snapshot
📊Channel Reference Grid
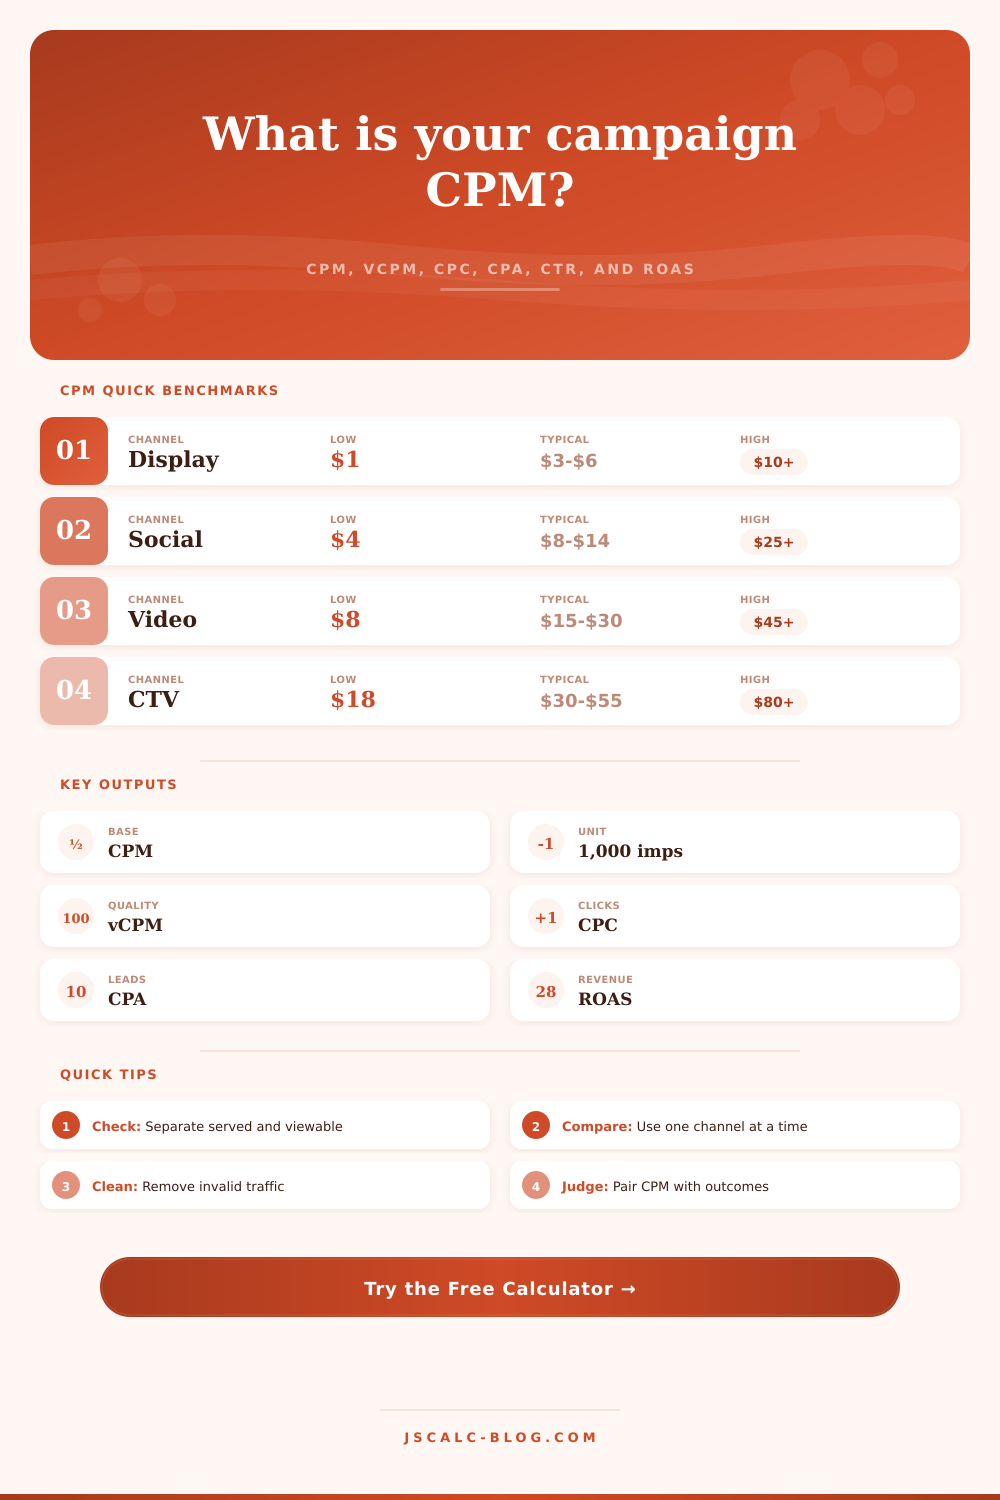
📘CPM Benchmark Table
| Channel | Low CPM | Typical CPM | High CPM | Viewability Guide | Best Comparison Metric |
|---|---|---|---|---|---|
| Display banners | $1 to $3 | $3 to $6 | $10+ | 45% to 65% | Adjusted CPM and CTR |
| Paid social feed | $4 to $8 | $8 to $14 | $25+ | 55% to 75% | CPM, CTR, and CPA |
| Online video | $8 to $15 | $15 to $30 | $45+ | 65% to 85% | vCPM and completed views |
| Search display network | $2 to $6 | $6 to $12 | $20+ | 45% to 70% | CPM and CPC together |
| Newsletter sponsorship | $15 to $30 | $30 to $60 | $90+ | Open rate dependent | CPM, clicks, and leads |
| Native content placement | $5 to $12 | $12 to $25 | $40+ | 50% to 75% | Engaged visit rate |
| Retail media network | $8 to $18 | $18 to $35 | $60+ | 55% to 80% | CPM, ROAS, and units sold |
| Connected TV | $18 to $30 | $30 to $55 | $80+ | 80% to 95% | Reach, frequency, and lift |
📌Preset Scenario Details
| Preset | Spend | Impressions | Viewable | Clicks | Conversions | Revenue | Use Case |
|---|---|---|---|---|---|---|---|
| Display Retargeting | $12,500 | 1,850,000 | 68% | 9,250 | 410 | $39,200 | Lower funnel banner remarketing |
| Social Awareness | $28,000 | 2,400,000 | 72% | 18,200 | 620 | $54,000 | Feed reach with traffic signal |
| Video Launch | $45,000 | 1,650,000 | 76% | 11,800 | 510 | $88,000 | Product launch video flight |
| Newsletter Sponsor | $9,600 | 240,000 | 88% | 3,850 | 290 | $31,500 | High-intent owned-audience placement |
| CTV Flight | $120,000 | 2,700,000 | 91% | 0 | 760 | $210,000 | Lean-back video reach and lift |
| Programmatic Prospecting | $18,000 | 3,800,000 | 54% | 7,600 | 185 | $22,000 | Broad audience discovery |
| Native Content Boost | $16,500 | 825,000 | 63% | 10,725 | 340 | $46,000 | Sponsored article distribution |
| Podcast Display Bundle | $22,000 | 620,000 | 70% | 4,100 | 190 | $36,000 | Companion display around audio ads |
| Retail Media Promo | $35,000 | 1,180,000 | 78% | 16,400 | 980 | $154,000 | Sponsored product and display mix |
⚖Metric Formula Reference
🔍Reading CPM With Outcome Metrics
| Pattern | CPM Signal | Outcome Signal | Likely Reading | Next Check |
|---|---|---|---|---|
| Efficient reach | Below target | Stable CTR | Media is buying reach efficiently | Watch frequency and fatigue |
| Cheap but weak | Low CPM | Low CTR or CPA weak | Inventory may be broad or low intent | Segment audience quality |
| Premium winner | Above target | Strong ROAS or CPA | Higher CPM may still be justified | Scale while outcome rate holds |
| Hidden waste | Normal served CPM | High vCPM | Viewability or invalid traffic is hurting quality | Review placement exclusions |
| Reach saturation | Rising CPM | Falling CTR | Audience may be overexposed | Lower frequency or refresh creative |
| Measurement gap | Good CPM | No conversion signal | Tracking or attribution may be incomplete | Audit tags and lookback windows |
🧭CPM Planning Ranges
| Plan Type | Impression Goal | Typical CPM | Spend Formula | Planning Note |
|---|---|---|---|---|
| Local display test | 100,000 | $3 to $8 | Goal x CPM / 1,000 | Small enough for creative learning |
| Social reach burst | 500,000 | $8 to $16 | Goal x CPM / 1,000 | Monitor frequency after launch |
| Video launch | 1,000,000 | $15 to $35 | Goal x CPM / 1,000 | Compare served CPM with vCPM |
| Newsletter sponsorship | 250,000 | $30 to $70 | Goal x CPM / 1,000 | Audience fit matters more than low CPM |
| Retail media push | 750,000 | $18 to $45 | Goal x CPM / 1,000 | Use sales return as the final filter |
| CTV awareness flight | 2,000,000 | $30 to $70 | Goal x CPM / 1,000 | Estimate reach from frequency caps |
💡CPM Optimization Tips
The cost per mille formula is familiar to most advertisers: Divide spend by impressions; then multiply by 1,000. This is simple arithmetic that seems like a full solution… Until it’s not. A low CPM may or may not be a trap. And the value of a high CPM may or may not be a bargain. What comes after the ad loads matter.
The calculator up top take care of the math when you plug in your numbers (impressions, spend). It spares you guessing about conversions and coefficients. It require you to consider downstream revenue. You also need to consider viewability, invalid traffic, and headline rate.
Why CPM Is Not The Only Number That Matters
1) Don’t compare served impressions to viewable outcomes as if they has the same denominator. Your platform says you pay five dollars per thousand ad impressions, yet only sixty percent of them reach human eyeballs. In other words, you’re paying a much higher price for attention different than what your dashboard suggests. So strip out the noise. The tool allow you to adjust for invalid traffic before calculating end rate. Why? Two percent might sound like nothing, but it skews your actual cost basis when scaled up. You are buying visibility, not delivery.
It’s not only about raw numbers, but also about context of the channel where those numbers appear. Twenty five dollars per thousand sounds like a hefty CPM for banner ads across broad display. But that’s totally normal for newsletter sponsorships, or connected TV. And there’s a chart on the page that explain, by channel, what the low, typical and high benchmarks are. Don’t try judging a CTV flight by display metrics. Context matters, and so does type of placement, such as whether it is intended to be watched. Where is it appearing? That require an investment in production value and attention that static banners don’t. You’re paying for that friction.
And then there are the outcomes. If people aren’t clicking or buying, what good is a low-cost CPM? The calculator link the media cost with clicks, conversions, and revenue. That makes it a measure of profitability rather than just a vanity stat. Perhaps you’re spending ten dollars per mille, but for an audience where each conversion lead to $50 in revenue, this pricey media is in fact extremely efficient. The true story lie in its return on ad spend. It closes the gap between media buying and business results.
The other quiet assassin is frequency. Showing someone the same ad a dozen times can lowers your CPM. By repeatedly buying up the same impression, you’re driving down average rate. This is where Reach comes in. Based off what you tell it about your desired frequency, the tool will estimate how many unique people you’re reaching. So if you notice your frequency increasing, and your click-through rate decreases, then you know that you’ve reached saturation, the audience’s tired of seeing this ad. It is time to seek out new audiences (or refresh the creative).
That leaves you with a tension when planning a campaign. How do you reach many people without wasting money? How do you engage them deeply without tiring them out? How do you get strong results without going over budget? The calculator’s presets gives you a place to start on some of these typical situations, ranging from a push into retail media to a burst to raise social awareness. Think of them as a starting point rather than a rule. Tweak them based off your particular audience and product.
At the end of the day though, that’s just the entrance fee. CPM is simply the price of getting your foot in the door. What you do once you’re there? That’s where the value lies. If it’s an ad for a new product, you want people to see it. But more importantly, you want them to see it in a way that has meaning. If you need to move old inventory, you want people to see it. Again. In a way that makes a differnce. Always tie the cost to the revenue it creates. Match rates to quality metrics. Don’t let your denominators gets mixed up. This is how you should of stop guessing and begin to optimize.