Cost Per Acquisition Calculator
Measure the true cost per acquisition for paid campaigns, affiliate programs, outbound teams, marketplaces, or blended growth. Enter spend, fees, attribution credit, funnel counts, acquisition quality, revenue, and margin to see CPA, break-even CPA, ROAS, payback, and funnel efficiency.
🎯CPA Scenario Presets
🧮Campaign Inputs
This changes display only; enter all money values in one currency.
Benchmarks adjust reference guidance and diagnostics.
Period normalizes acquisition run rate and daily spend.
Use less than 100 when only part of the result is credited to this campaign.
Ad spend, placement spend, affiliate commissions, or campaign outlay.
Include creative, tools, list fees, agency fees, or contractor time.
Use the measurable traffic step before leads or signups.
Intermediate conversions used to diagnose funnel loss.
Final acquired customers, subscriptions, purchases, or approved accounts.
Removes low-quality acquisitions from effective CPA.
Use first-order revenue, first contract value, or expected first-period revenue.
Break-even CPA uses revenue multiplied by gross margin.
Optional operating target for pacing and status checks.
Used for LTV:CAC ratio and longer-window acquisition judgment.
🔢Current Acquisition Snapshot
📐Formula Breakdown
📋Preset CPA Comparison Grid
| Scenario | Channel | Spend + Fees | Clicks | Leads | Acq. | Invalid | Revenue | Margin | Typical Use |
|---|---|---|---|---|---|---|---|---|---|
| SaaS search trial | Paid search | $14.3k | 8,200 | 615 | 92 | 4% | $420 | 72% | Trial-to-paid funnel review |
| Ecommerce social push | Paid social | $9.7k | 18,500 | 1,480 | 248 | 8% | $86 | 48% | First-order acquisition |
| Local service leads | Paid search | $4.9k | 2,250 | 185 | 37 | 5% | $620 | 58% | Booked jobs from leads |
| Affiliate launch | Affiliate | $6.2k | 5,100 | 920 | 116 | 3% | $130 | 52% | Partner payout control |
| Marketplace promo | Marketplace | $11.1k | 24,000 | 2,880 | 410 | 12% | $54 | 36% | Deal-driven order volume |
| B2B webinar funnel | Content synd. | $22.8k | 6,400 | 780 | 42 | 2% | $1,850 | 81% | Lead quality analysis |
| Mobile app installs | Paid social | $18.4k | 62,000 | 14,900 | 1,120 | 18% | $28 | 65% | Install-to-payer cohort |
| Outbound SDR sprint | Outbound | $31.5k | 3,800 | 310 | 28 | 0% | $4,200 | 76% | Sales-assisted acquisition |
| Blended monthly growth | Blended | $48.2k | 39,000 | 4,200 | 760 | 6% | $115 | 55% | Total acquisition pulse |
💡Channel Reference Benchmarks
| Channel | CPC Pattern | Lead Rate | Close Rate | CPA Watchpoint |
|---|---|---|---|---|
| Paid search | Higher intent, higher CPC | 5% to 12% | 8% to 20% | Keyword mix can raise CPA fast |
| Paid social | Lower CPC, colder traffic | 3% to 10% | 5% to 16% | Creative fatigue often lifts CPA |
| Display retargeting | Low CPC, narrow pool | 4% to 14% | 8% to 22% | Frequency can over-credit returns |
| Affiliate or partner | Commission tied to result | 8% to 25% | 8% to 18% | Quality rules protect valid CPA |
| Marketplace promotion | Fees replace direct CPC | 8% to 18% | 10% to 25% | Discounting can hide margin loss |
| Outbound sales | Labor-heavy contact cost | 4% to 12% | 6% to 18% | Include SDR and data costs |
| Content syndication | Lead package cost | 10% to 30% | 2% to 9% | Validate fit before counting MQLs |
| Blended acquisition | Mixed paid and organic | 6% to 16% | 8% to 20% | Use separate cuts for decisions |
🔍Funnel Diagnostic Table
| Metric | Formula | Good Sign | Risk Sign | Action |
|---|---|---|---|---|
| Cost per click | spend / clicks | Stable with quality | Rising without close-rate gain | Review bids and targeting |
| Click to lead | leads / clicks | Landing page matches intent | Low rate with high traffic | Test offer and page friction |
| Lead close rate | acquisitions / leads | Lead quality is holding | High lead volume, weak close | Tighten qualification rules |
| Cost per acquisition | spend / valid acquisitions | Below target and break-even | Above contribution limit | Pause, segment, or fix funnel |
| ROAS | revenue / spend | Above margin-required level | Looks high but margin is thin | Compare against gross profit |
| LTV:CAC | LTV / CPA | 3:1 or stronger | Below 1.5:1 | Improve retention or cut CPA |
📌CPA Quality Tips
Remember the time you threw some money on a digital marketing campaign, saw zero results, and felt like throwing the whole thing against the wall? Yeah. That’s the sensation of screaming into a canyon and getting nothing back except wind.
Most marketers will stop there: “We got tons of clicks! Our conversions is through the roof!” It’s a dangerous game. To see if your growth is profitable, you need to get past those surface numbers, because that’s where the real story lies. In the cost per acquisition, or CPA. The calculator above do the math for you, but knowing how it works helps keep your budget from bleeding out.
How to Check if Your Marketing Makes Money
One hidden cost is one of the first traps people fall into. They see media spend as obvious; they overlook the other costs; software tools, agency retainers, creative fees, which quicky begin to add up. And if you’re reviewing a campaign based off what you see in the ad platform’s dashboard, you’re looking at a sanitized version of reality. This tool allow you to layer those non-media fee into your total spend, to calculate an all-in CPA that actualy represents your bank account. It’s a minor adjustment to the input that shift the whole decision about whether to save a campaign.
This is the question of quality. And here’s where not all conversions are created equaly. For example, if you’re a lead gen company, getting a qualified prospect on the phone doesn’t mean much if they bounce off the line or get disqualified. Early churn, refunds, or even invalid acquisitions has to be accounted for. The calculator lets you discount based on a percent of these “losses” and increases your actual CPA while providing more accurate snapshot of efficiency. Failing to do so is like doing an experiment, then claiming credit when it fail. Sure, it makes you feel better at the time. But your long term margins suffers.
So now we’ve got our nice and tidy CPA. Now let’s see how this stacks up different than our break even point. Here’s where gross margin enters the picture. Gross margin = (revenue, cost of goods/services). Gross margin is what allow us to understand if someone is making money from their products or just spending lots of money to get more people to look at their website. For example, having a very high ROAS on a low margin product could end up being a negative number.
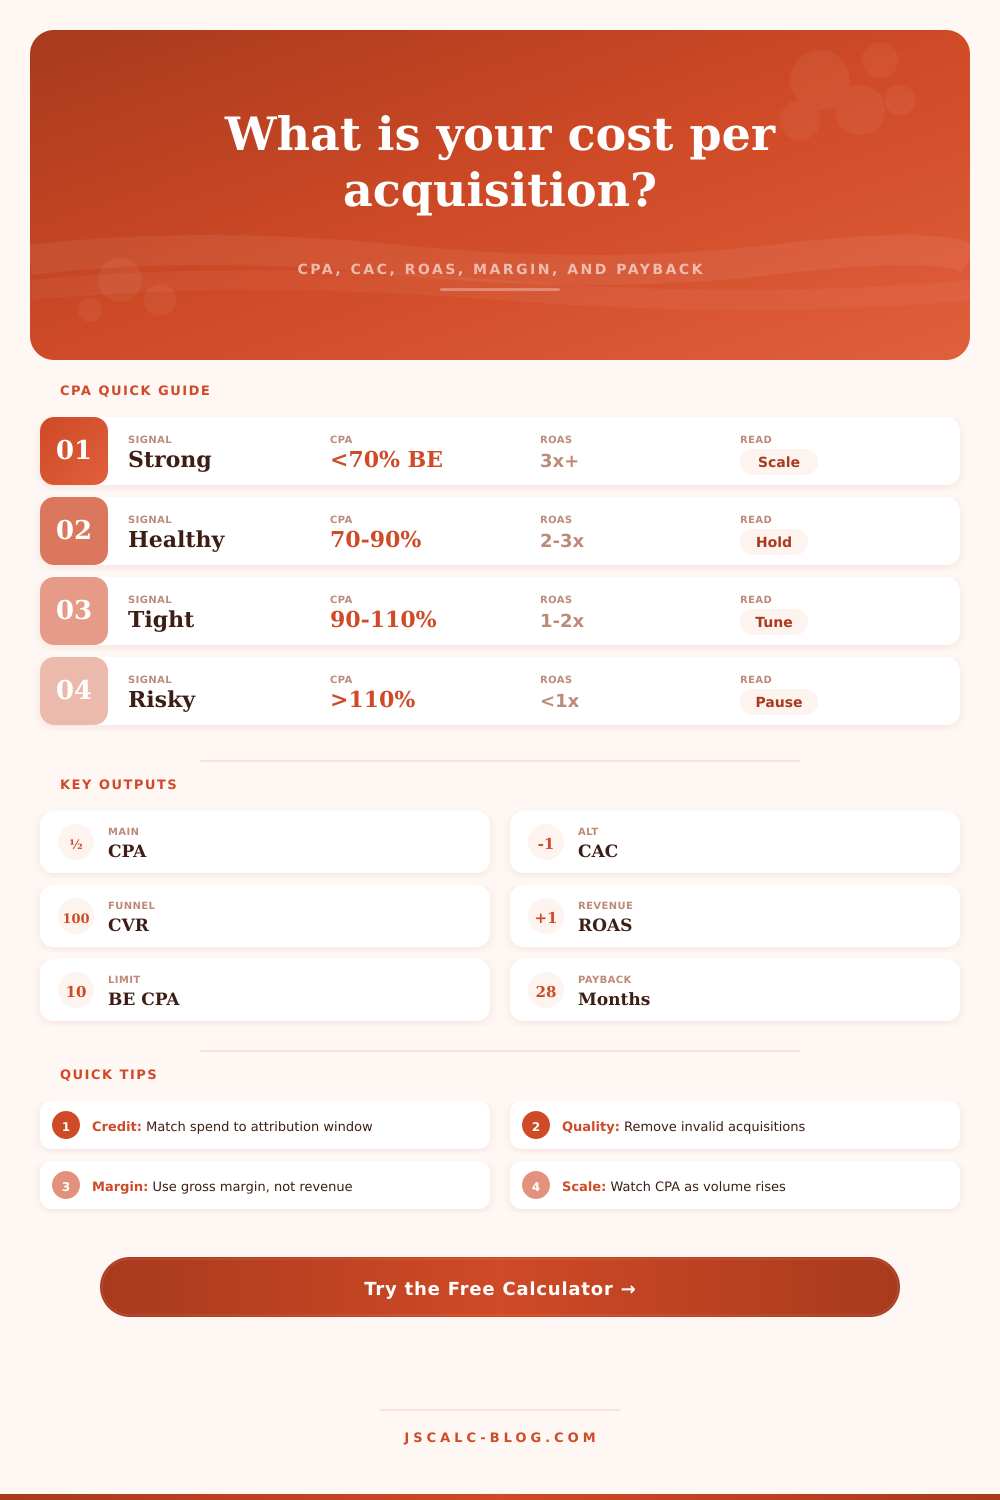
Your Break Even CPA = your average revenue x gross margin %. So if your real-world CPA is less than this amount then you’re contributing positively in terms of gross contribution. If your CPA is greater than this then you are contributing negatively. You are spending money to acquire customers. And this is the black-and-white truth about performance marketing.
Also note the factor of time. You spend money now to acquire, but realize revenue later. That’s what the LTV to CAC ratio captures. If the customer lasts years and provides ongoing value then an otherwise unaffordable cost per acquisition may make sense. You’ll see the payback period visualized in the calculator, how many months until you earn back what you spent. Shorter = more cash flowing back into your pocket to reinvest. Longer = capital tied up that could instead work somewhere else.
But also, different channels react differently. Some has higher costs, such as paid search. Some have higher intent. Others can deliver volume, like paid social, but bring in cold traffic. The reference benchmarks they provide on the page will put your own numbers into context of what’s normal within your own niche. What is scary looking as a CPA in one channel may be outstanding in another. Don’t judge a fish on how it climbs a tree; don’t judge a social campaign by search metrics.
And finally: Growth is a balance of efficiency vs. Speed. If you’re flush with cash, you can buy as many customer as you want for any price, but you need a healthy unit economics loop for sustainable growth. Before you launch, use the tool to stress-test your scenarios. Tweak the inputs, watch the outputs shift and locate that sweet spot where profits and volume meet. Because it’s not all about getting clicks, it’s also about keeping the lights on as you grow.