Click-Through Rate Calculator
Calculate CTR from impressions and clicks, adjust for invalid clicks, compare against channel benchmarks, and translate a target CTR into click goals, projected traffic, and required impressions.
🎯CTR Scenario Presets
🧮Campaign Inputs
Benchmarks are reference ranges for comparing your observed CTR.
This changes the decision wording in the result breakdown.
Count delivered views, sends, placements, or result impressions.
Use raw click count before invalid click adjustment.
Adjusted clicks are used for CTR, projections, and quality rates.
Enter the CTR goal you want to compare against.
Used to forecast clicks if the current CTR continues.
The calculator estimates impressions needed at the target CTR.
Optional downstream completions from clicks, such as signups.
Rounding affects planning outputs, not the measured CTR.
📌Current CTR Snapshot
🗂Channel CTR Reference Grid
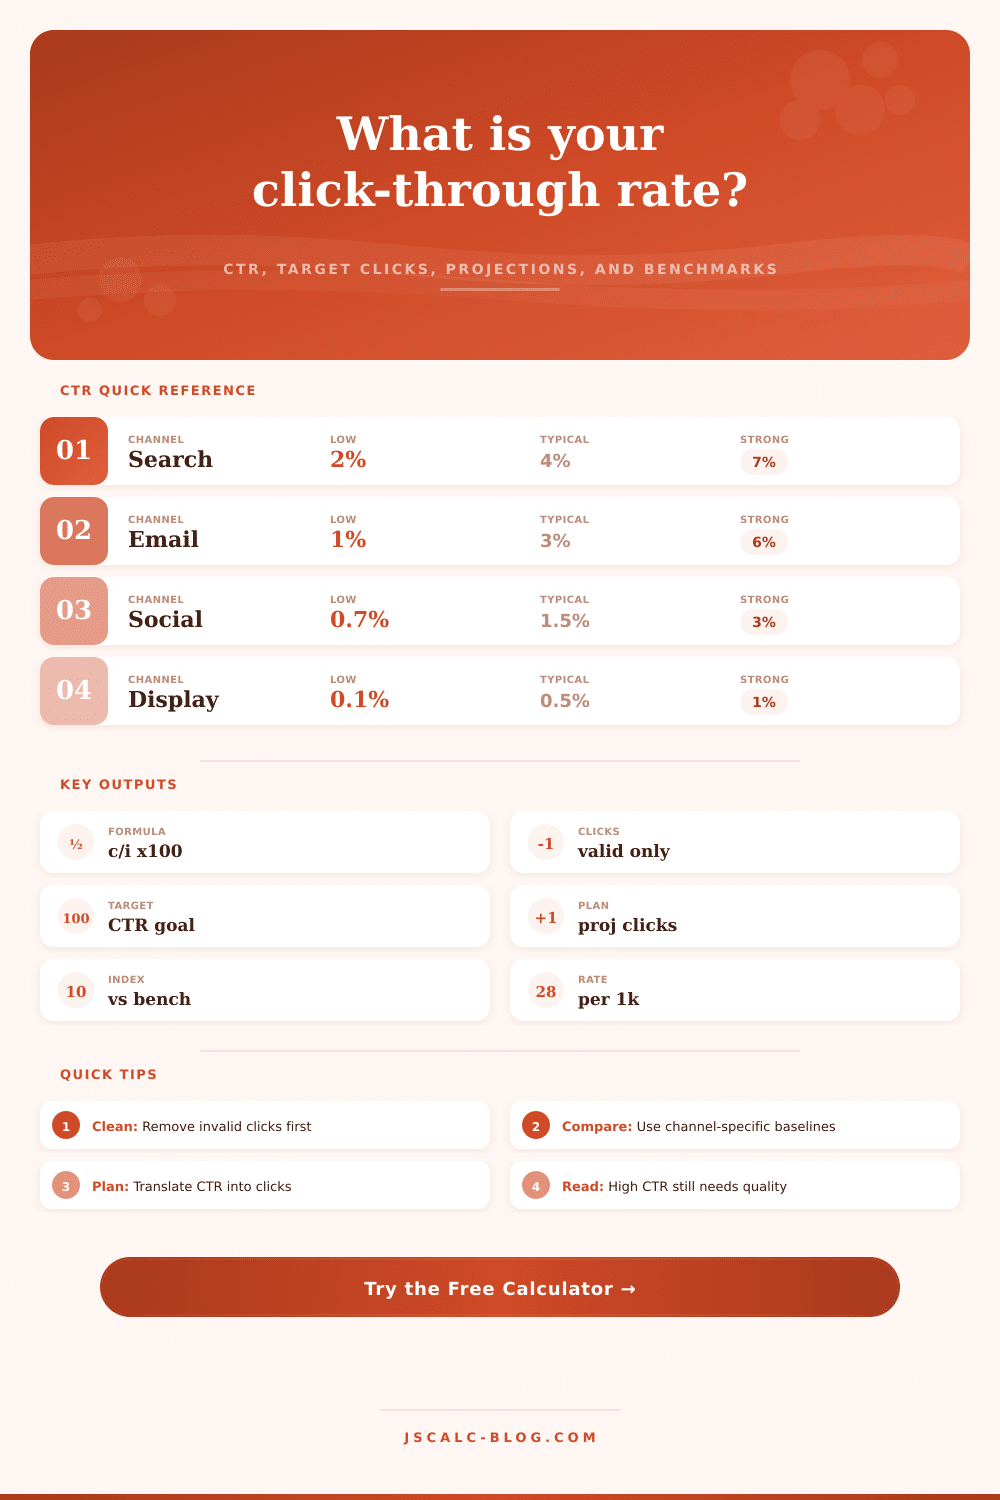
📊CTR Benchmarks by Channel
| Channel | Low CTR | Benchmark CTR | Strong CTR | Best Comparison Use |
|---|---|---|---|---|
| Search ad or intent keyword | 2.0% | 4.0% | 7.0% | High-intent paid search groups |
| Email newsletter link | 1.0% | 3.0% | 6.0% | Campaign links inside send reports |
| Paid social feed post | 0.7% | 1.5% | 3.0% | Feed ads, carousel units, story ads |
| Display or banner placement | 0.1% | 0.5% | 1.0% | Retargeting, banners, programmatic placements |
| Native content recommendation | 0.4% | 1.2% | 2.2% | Sponsored article and content widgets |
| Organic search result | 2.0% | 5.0% | 12.0% | Search Console result impressions |
| Push notification | 2.5% | 6.0% | 12.0% | App or browser push campaigns |
| On-site CTA or module | 0.8% | 2.5% | 5.0% | Homepage modules, blog CTAs, internal banners |
📝Preset Scenario Comparison
| Scenario | Impressions | Clicks | CTR | Target | Planning Read |
|---|---|---|---|---|---|
| Newsletter hero link | 85,000 | 2,975 | 3.50% | 4.00% | Needs 425 more clicks |
| Search ad campaign | 42,500 | 2,210 | 5.20% | 5.00% | Slightly above goal |
| Social carousel ad | 310,000 | 4,185 | 1.35% | 1.75% | Creative gap visible |
| Display remarketing | 720,000 | 4,320 | 0.60% | 0.75% | High volume, small rate gap |
| Product launch banner | 150,000 | 3,900 | 2.60% | 3.00% | Needs stronger message match |
| Blog CTA module | 64,000 | 1,408 | 2.20% | 2.50% | Close to on-site benchmark |
| Push notification | 28,000 | 2,100 | 7.50% | 7.00% | Above target, check quality |
| Affiliate text link | 18,500 | 629 | 3.40% | 3.25% | Target met on small base |
| Low traffic test | 1,250 | 33 | 2.64% | 3.00% | Need more impressions to judge |
📐Target Planning Table
| Target CTR | Clicks per 10k Impressions | Clicks per 100k Impressions | Impressions for 1,000 Clicks | Typical Use |
|---|---|---|---|---|
| 0.50% | 50 | 500 | 200,000 | Display and broad awareness |
| 1.00% | 100 | 1,000 | 100,000 | Native or broad paid social |
| 1.50% | 150 | 1,500 | 66,667 | Social feed campaign target |
| 3.00% | 300 | 3,000 | 33,334 | Email, CTA, or stronger social |
| 5.00% | 500 | 5,000 | 20,000 | Search or high-intent audience |
| 8.00% | 800 | 8,000 | 12,500 | Push or tightly matched offer |
⚙CTR Formula Breakdown
💡CTR Reading Tips
So you hit Send on the newsletter and then you wait for the open rates. And they’re fine. And then you check the clicks. Or rather, the non-clicks.
Anyone managing traffic knows that moment: that moment when data isn’t just your strategy; it’s your mistake. Whether or not people saw it is one thing. But did they care enough to do something? Did they make jump from seeing to doing?
How to Use This Click-Through Rate Calculator
That jump, that gap between seeing and doing. Are the lifeblood of click-through rate. It is a simple fraction on paper, but a measure of intent in practice.
You put your raw served impressions and clicks into the calculator above and it will do math for you. But meat of this is figuring out how that apply to your own channel.
A search ad isn’t judged on par with a display banner. Searchers want something and they click when they need an answer. Display ads interrupt and people click if you were able to catch their eye long enough to halt their scroll. Expecting them to perform equally is more different than evaluating a sprinter based on their marathon time. It doesn’t make sense. The tool help split these contexts up for you so you don’t have to guess how you compare.
First look at your invalid click adjustment (the thing nobody skips). There is all sorts of things that pollute your data; bots, accidental taps, duplicate entries. And if you don’t filter it out, your CTR will look artificially high. The calculator give you the chance to strip that noise away before it infects your projections, because you think you’re winning but really you’re just counting noise. Your entire budget plan is built on sand if you build a prediction on dirty data. Before you decide to spend more money, you’ve got to know what true engagement looks like. And a clean denominator matter.
Then take that rate and divide it by the Benchmark Index (your rate relative to the channel average). So if your index is less than 100, you’re under-performing; if it’s greater than 100, then you’re beating the odds… But here’s the thing: Beating the average isn’t the same as being profitable. You can beat the average by getting more clicks without any sales. Or you could get fewer clicks than average but convert them all anyway. The point is, you’ll know you aren’t invisible.
However, you will still want to see how people act after they click (post-click action rate). The calculator gives you that gap in rates. And it forces you to consider the post-click action, rather than just the click.
Run your scenario with target CTR field and then figure out what number of impressions you must deliver in order to hit that thousand-click goal. It varies based off whether you’re sending push notifications or buying social ads. Push is personal and lives on lock screen, where you can command people’s attention. On social, you’re competing for millisecond glances in a crowded feed. Your rates will thus be different; the tool’s planner table spells it all out clearly, turning those abstract percentage targets into concrete volume goals. You’ll cease thinking in terms of rates and begin to think in traffic.
You needn’t get hung up on any one number, CTR goes up and down and is pulled in many directions by audience burn out/creative fatigue/seasonal etc. So don’t assume that if something drops suddenly that it’s time to kill the campaign. It could just be that the audience has now seen that image X too many times. Try swapping the creative. Try testing a different angle. See if the rate starts to climb back.
Having a baseline that you can compare yourself to is what the tool helps with. You know where you’re at. You know where you want to be. And that’s the gap. That is your action plan.
So finally: CTR is a diagnostic tool. Not the cure. A diagnostic tool that tells you whether or not you’re getting your message across. A diagnostic tool for finding the leaks in your funnel, so you can go plug them.
Use the calculator. Find the leaks in your funnel. Go plug them. The math’s easy. The strategy’s hard. Can’t fix what you don’t measure.
Start with the clicks, follow the intent, and the rest naturaly falls into place.