Conversion Rate Calculator
Calculate conversion rate from real counts, compare it with a target, estimate conversion lift, forecast future results, and find how much traffic is needed to reach a goal.
🎯Conversion Rate Presets
🧮Conversion Inputs
Context supplies comparison benchmarks and interpretation language.
Use the same denominator for every reporting period.
Count the exact successful actions in the period.
This is the full audience that could have converted.
Used to calculate the target gap and needed conversions.
A 12% lift turns a 4.00% rate into 4.48%.
Estimate future conversions at current, lifted, and target rates.
Used for daily conversion and visitor pace.
The calculator finds visitors needed to hit this goal.
Planning outputs use whole conversions and visitors.
🔢Current Rate Snapshot
📊Conversion Context Benchmarks
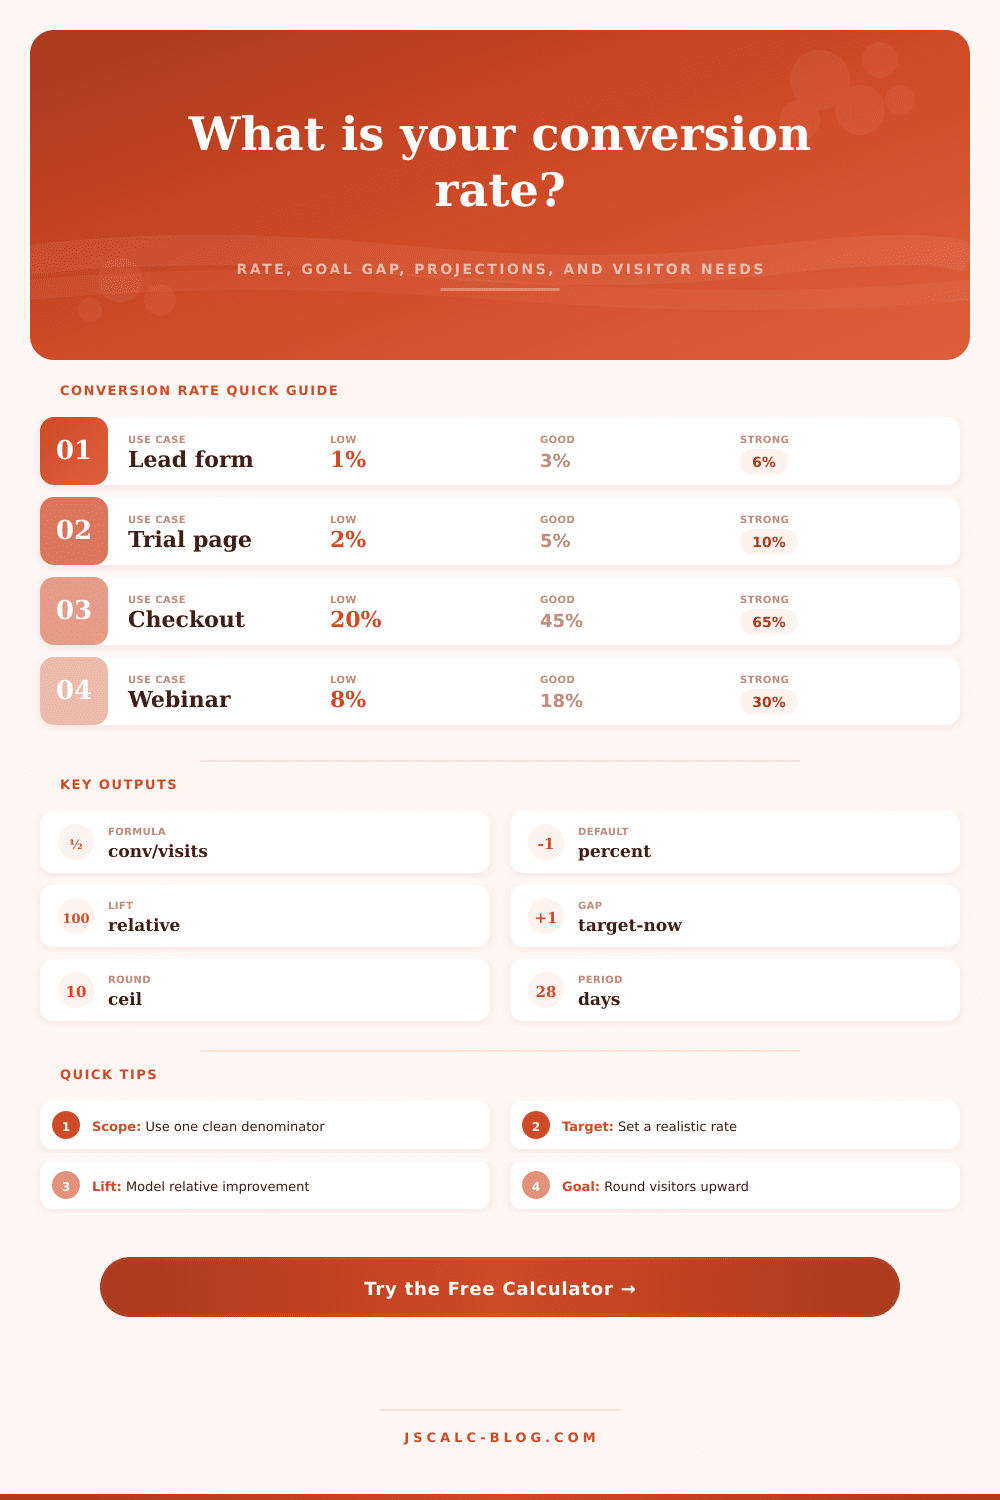
| Conversion Context | Typical Denominator | Low Rate | Good Rate | Strong Rate | Best Use In Calculator |
|---|---|---|---|---|---|
| Lead form submission | Unique visitors | 1.0% | 3.0% | 6.0% | Landing pages, contact forms, newsletter opt-ins |
| SaaS trial signup | Website visitors | 2.0% | 5.0% | 10.0% | Free trial pages, product-led growth funnels |
| Webinar or event registration | Invite clicks | 8.0% | 18.0% | 30.0% | Email campaign and event registration pages |
| Product page add-to-cart | Product page sessions | 4.0% | 8.0% | 15.0% | Ecommerce product detail page testing |
| Checkout completion | Checkout starts | 20.0% | 45.0% | 65.0% | Cart, checkout, payment, and form flow analysis |
| Download or gated asset | Page visitors | 5.0% | 12.0% | 25.0% | Guide downloads, templates, and resource libraries |
| Demo or quote request | Qualified visitors | 0.7% | 2.0% | 5.0% | High-intent B2B forms and sales handoff pages |
| App activation milestone | Signed-up users | 15.0% | 35.0% | 55.0% | First key action, setup completion, or onboarding success |
📌Preset Scenario Reference
| Preset | Conversions | Audience | Observed Rate | Target | Lift Plan | Forecast Audience | Goal |
|---|---|---|---|---|---|---|---|
| Landing page lead form | 168 | 4,200 | 4.00% | 5.50% | 12% | 5,200 | 275 |
| SaaS trial signup | 310 | 7,750 | 4.00% | 6.00% | 18% | 8,400 | 500 |
| Webinar registration | 540 | 3,000 | 18.00% | 22.00% | 10% | 3,600 | 720 |
| Product page add-to-cart | 980 | 12,400 | 7.90% | 9.50% | 15% | 14,000 | 1,300 |
| Checkout completion | 1,170 | 2,600 | 45.00% | 52.00% | 8% | 2,900 | 1,500 |
| Mobile app activation | 2,180 | 6,400 | 34.06% | 40.00% | 12% | 7,200 | 2,700 |
| Lead magnet download | 690 | 5,750 | 12.00% | 15.00% | 14% | 6,200 | 900 |
| Demo request page | 92 | 4,600 | 2.00% | 3.20% | 20% | 5,000 | 160 |
| Paid search campaign | 225 | 9,000 | 2.50% | 3.50% | 16% | 10,500 | 360 |
🧭Conversion Rate Formula Guide
🔍Planning Interpretation Table
| Signal | Calculator Pattern | Plain Reading | Next Planning Move |
|---|---|---|---|
| Below low benchmark | Observed rate below low band | The page or funnel likely has friction before the conversion action | Review offer match, message clarity, and form burden |
| Inside good band | Observed rate near typical range | Rate is usable for planning, but target lift still matters | Forecast traffic and test one high-impact change |
| Strong benchmark | Observed rate meets strong band | The current funnel is already converting well for its context | Protect quality while looking for incremental gains |
| High target gap | Needed conversions are large at current traffic | Traffic alone may not cover the desired goal | Combine traffic growth with rate improvement |
| Negative gap | Current rate already beats target | The target is already achieved for the entered audience | Raise the target or shift to consistency monitoring |
| Goal traffic gap | Visitors needed exceeds forecast visitors | The goal needs more traffic, a higher rate, or both | Adjust campaign volume or lift assumptions |
💡Conversion Rate Tips
You can spend all day building out a nice-looking landing page: a fast-loading site, clear copy, nice design. But they might not converts. Why? Because issue isn’t always obvious.
It is in the mathematics of human behavior, and you won’t fix it by making your page look pretty.
How to Fix Your Conversion Rate
We tend to obsess over traffic volume because new visitors feel like growth. So you chase more and more traffic. Traffic volume tends to be thing you obsess about. But you’re only pouring water into a bucket with a hole in the bottom if you aren’t fixing how well you convert users.
Conversion rate is usually treated like a static badge of honor. “We got three percent!” “That’s awesome! We got four percent!” That’s great, but only in context.
Three percent on a high-ticket B2B demo request? World class. Three percent on a basic newsletter signup? Disaster in the making.
Before you let the calculator do its thing (it’ll help you with the math), you have to define denominator. What is it: Ad clicks? Sessions? Unique visitors? Mess around with those and you’re lying to yourself faster then you can say “conversion optimization.”
Are you counting sessions? Don’t forget that some people loaded the page twice. Your rate appear artificially deflated. Keep the denominator clean; it is basis for every decision you will make from now on.
Now that you know where you stand, you want a target, one that’s realistic. It turns out there are different benchmarks based off context. The page contains a reference table with those targets broken down by funnel stage so you can see what “strong”, “good” or “low” look like for you.
So if you’re in the good band, don’t freak out. But also don’t pat yourself on the back.
This is where the real magic starts: modeling relative lift. Relative increases sound modest, e.g., “twelve percent“. But multiply that times thousands of visitors and that’s some serious magic. People make the mistake of assuming they must double their rate to see any results. Truth is: Small, incremental improvements adds up aggressively over time. The calculator will show you exactly how many more conversions you’ll get from these changes, while never having to buy another ad click.
This is the next step. The plan is the fun part, when optimism meets reality. Next month, two-hundred new leads are your goal. How many visitors do you really need to achieve that? The tool consider your current performance and expected improvement.
If it says you’ll need more visitors than you can reasonably generate or afford, it is time for a decision. Should you double down on optimization? Should you increase your marketing spend? More often than not, it’s both, but optimization is the cheaper and longer-term solution.
Round up your visitor requirements because you don’t give partial conversions. That shields your planning from inevitable friction of the real world.
The level of detail helps you respond quicker. You don’t have to wait until the end of the month to see that you’re lagging behind your goal. For example, if your goal is 5 conversions per day and you’ve only been converting 3 per day, you will see it in the morning. Instead of waiting, you can fix broken form field now, change your message, etc.
The detail gives you a visual snapshot of today. It strips out the noise of the monthly average and tells you what’s happening right now. It is not just what has happened historically.
So, how do we actualy do it? Conversion rate optimization (CRO) is a game of accuracy and patience, first and last. You’ll implement what appears to be a clever change; yet no dice. You’ll resolve something small, which ends up making a big difference. This tool removes the guesswork from the arithmetic; it leaves you to focus on the psychology.
Ask yourself: What was missing? Why didn’t they convert? The answer lies in the numbers; specifically, what. Your task is the why.
Begin with the cleanest denominator you can find. Establish a goal that pushes you, without breaking you. Monitor as the gap shrinks, point by percentage point. The bucket ceases its leakage. Eventually, it begins to fill.