Conversion Rate Lift Calculator
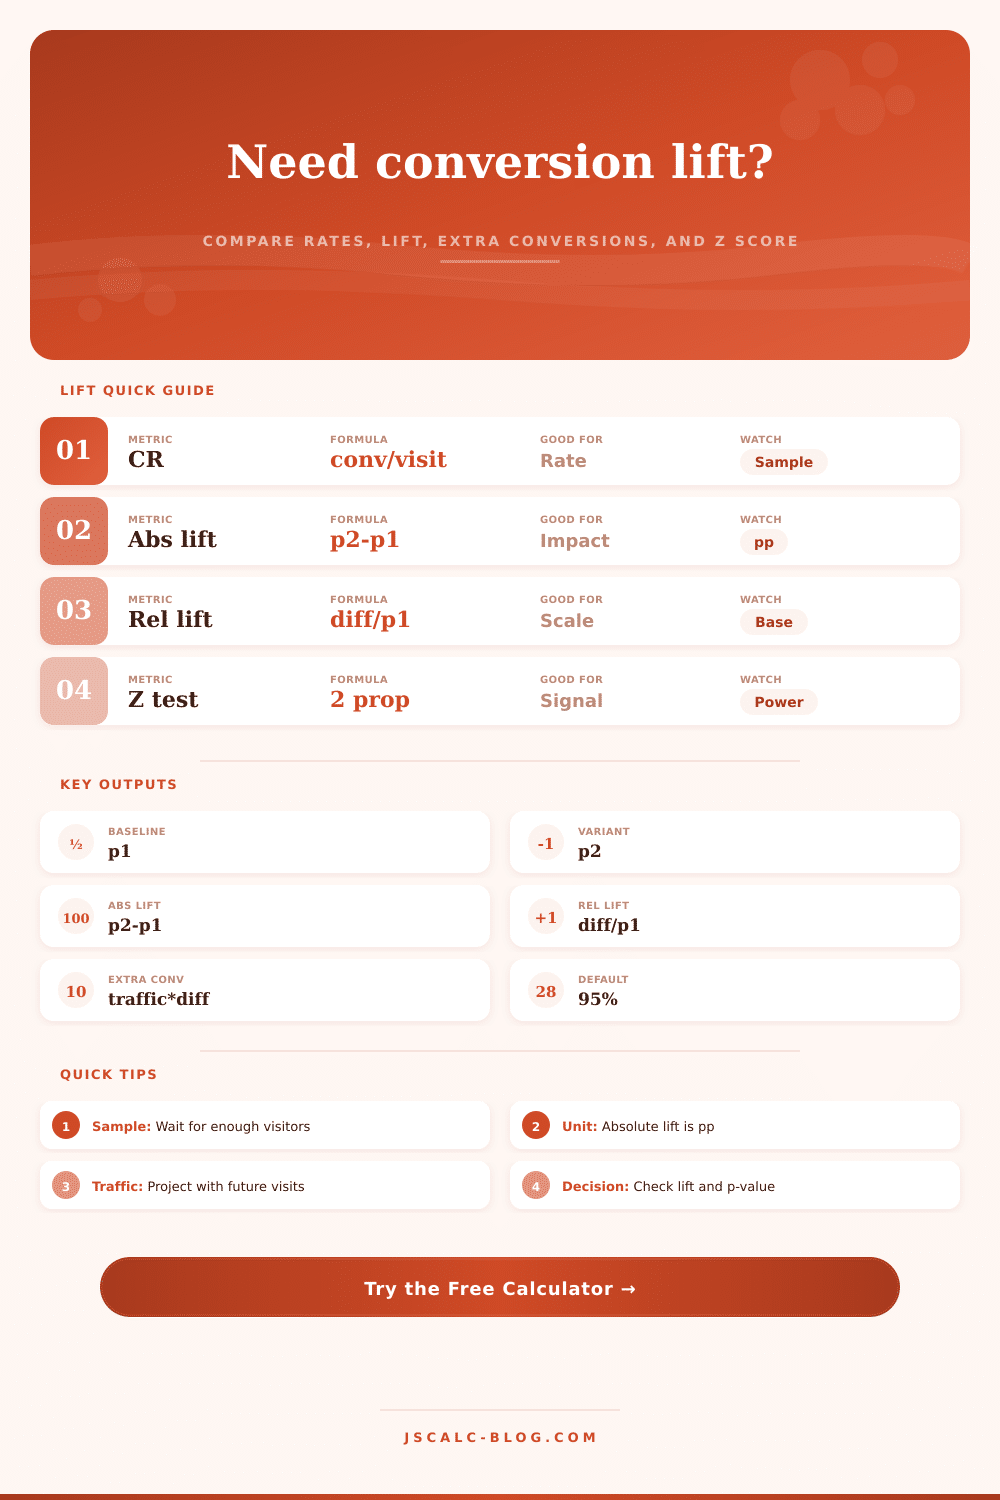
Compare baseline and variant conversion rates, then calculate absolute lift, relative lift, projected incremental conversions, pooled z significance, p-value, confidence interval, and rollout impact.
🎯Conversion Lift Presets
🧮Lift Inputs
Context changes wording in the result summary, not the core formulas.
The significance check uses a two-sided two-proportion z test.
Visitors, sessions, users, or eligible exposures in the control group.
Completed target actions in the baseline or control experience.
Visitors, sessions, users, or eligible exposures in the variant group.
Completed target actions in the tested experience.
Future traffic volume for incremental conversion projection.
Cards round display values only; formulas use unrounded rates.
🔢Current Lift Snapshot
📐Formula Breakdown
📋Preset Comparison Table
| Scenario | Baseline Visitors | Baseline Conv | Variant Visitors | Variant Conv | Abs Lift | Relative Lift | Projected Extra |
|---|---|---|---|---|---|---|---|
| Checkout button test | 12,000 | 420 | 11,980 | 497 | 0.65 pp | 18.6% | 324 / 50k |
| Pricing page signup | 8,400 | 286 | 8,360 | 341 | 0.67 pp | 19.8% | 335 / 50k |
| Trial onboarding flow | 18,200 | 2,275 | 18,150 | 2,430 | 0.88 pp | 7.1% | 702 / 80k |
| Email landing page | 5,100 | 459 | 5,050 | 515 | 1.20 pp | 13.3% | 301 / 25k |
| Paid search landing page | 9,600 | 288 | 9,580 | 340 | 0.55 pp | 18.4% | 221 / 40k |
| Demo request form | 3,250 | 143 | 3,270 | 171 | 0.83 pp | 18.8% | 125 / 15k |
| App activation step | 22,000 | 7,040 | 21,900 | 7,285 | 1.27 pp | 4.0% | 1,266 / 100k |
| Cart recovery offer | 4,800 | 624 | 4,820 | 710 | 1.73 pp | 13.3% | 433 / 25k |
| Flat holdout check | 15,000 | 600 | 15,100 | 602 | -0.01 pp | -0.3% | -6 / 60k |
🧭Lift Interpretation Bands
| Absolute Lift | Relative Lift | Typical Meaning | Decision Cue | Sample Concern | Rollout Reading |
|---|---|---|---|---|---|
| Below 0 pp | Negative | Variant underperforms | Investigate segment mix | Check randomization | Usually hold or revert |
| 0.00 to 0.09 pp | Usually small | Flat or tiny lift | Needs high traffic | Easy to overread | Wait for more data |
| 0.10 to 0.49 pp | Context dependent | Small but scalable | Useful on high traffic | Power matters | Project carefully |
| 0.50 to 0.99 pp | Often meaningful | Clear conversion gain | Check p-value and CI | Segment checks help | Strong rollout candidate |
| 1.00 to 1.99 pp | Large in many funnels | Visible business impact | Validate tracking | Guard against novelty | Roll out with monitoring |
| 2.00 pp or more | Very large | Major funnel change | Audit instrumentation | Often needs scrutiny | Confirm before full scale |
🔍Significance Reference Table
| Confidence | z Critical | Two-Sided Alpha | Stricter Than | Use Case | Reminder |
|---|---|---|---|---|---|
| 90% | 1.645 | 0.10 | No | Directional exploration | More false positives |
| 95% | 1.960 | 0.05 | 90% | Common A/B test readout | Still inspect effect size |
| 98% | 2.326 | 0.02 | 95% | High-risk decisions | Needs more traffic |
| 99% | 2.576 | 0.01 | 98% | Very conservative calls | May delay decisions |
| p < alpha | Pass | Selected alpha | n/a | Statistical signal | Not the same as importance |
| CI crosses 0 | Weak | n/a | n/a | Unclear lift direction | Usually collect more data |
🧪Conversion Metrics Comparison
| Metric | Formula | Unit | Best Use | Main Caution |
|---|---|---|---|---|
| Conversion rate | conversions / visitors | Percent | Normalize different sample sizes | Requires consistent visitor definition |
| Absolute lift | p2 - p1 | Percentage points | Shows direct rate-point impact | Can look small even when valuable |
| Relative lift | (p2 - p1) / p1 | Percent | Shows proportional improvement | Can inflate tiny baseline changes |
| Incremental conversions | traffic x (p2 - p1) | Conversions | Forecast rollout volume | Assumes future traffic behaves similarly |
| Pooled z score | diff / pooled SE | z units | Fast significance screen | Approximate with sparse data |
| Lift CI | diff +/- z x SE | Percentage points | Shows plausible lift range | Wide intervals need caution |
💡Practical Lift Tips
The most dangerous number in digital marketing are one that sounds impressive but has no meaning. You run an A/B test of your checkout page. You change the button color. The variant show a thirty percent relative lift. Team gives a high-five, then rolls it out across all pages. Three months later, revenue stayed flat.
That’s not how this works. The math held up, the context didn’t. Relative lift is tempting because it can scale small absolute gains into big percentage jumps. A shift from two percent to two point six percent becomes a thirty percent victory. It feel like progress. But it’s mostly noise.
How to Use the A/B Test Calculator Correctly
First, in order to make decisions that truly affect your bottom line, you must understand what it means when someone says “it has X% absolute lift” vs. It has Y% relative lift.” On this page, I’ve built a calculator to handle the math for you, while still allowing you to think through the consequenses. Simply input your baseline number of visitors, conversions, etc., followed by your variant group’s numbers and the tool instantly calculates both the proportional change (i.e. The relative increase) as well as the percentage point difference (i.e. This is the absolute increase.
Why? Because while ratios are interesting, your business doesn’t care about them, they cares about volume. One percentage point improvement on a page with fifty thousand visits per month will generate much more revenue than a 20% relative improvement on a page with only five hundred visit per month.
The other silent killer in optimization efforts is sample size. It’s all too easy to peek at your data too early, observe a promising trend and call it a day, declaring a winner well before the test reach statistical stability. To help with this, the calculator include a significance check (based off a two-proportion z-test) to help you know if what you’re seeing is likely real, or simply random variance. An inconclusive result mean there is a wide confidence interval or a high p-value. No amount of hoping will replace enough data. Sure, the results may look good and you may be tempted to stop the test early. But this often yields false positives. Run the test until significance metric stabilizes.
So when you’ve got something that’s statistically significant, what then? Project it! Enter your projected traffic volume, and it’ll tell you how many more conversions you should of get with this variant. This is where the abstract numbers starts to turn into concrete business outcomes. So you might say “I’m going to see ten thousand visitors next month, and my variant will add three hundred conversions.” Give those conversions a dollar value, and now you’re looking at a financial prediction based on a statistical finding. But you must assume that future traffic behave like the traffic in your test period. That’s reasonable for most tests, except if you’re running seasonal campaigns.)
The way the funnel leads to that metric is where many teams goes wrong and only look at the conversion rate. A higher conversion rate from one segment can hide a decrease elsewhere. Improving your sign-up process could lead to a boost in conversions overall. However, it could also cause a rise in churn because new path brings in lower quality leads. This means the short-term uplift isn’t real. Any changes should considers what happens further down the user journey. Although the calculator shows you the metrics for whatever step you’re testing, your plan need to reflect the whole journey.
At the end of the day, there’s no need to chase largest possible percentage. Optimization is about becoming more efficient and decreasing our uncertainty. Look at the absolute lift to see how much this affects your bottom line. Look at the relative lift so that you can communicate your results to people who operate by percentages. Run a significance check to confirm that you’re not optimizing for noise. The numbers will tell you if the change worked, but your job is to decide if it matters.