A/B Test Significance Calculator
Compare control and variant conversion counts with the standard two-proportion z-test. The calculator reports conversion rates, pooled standard error, z statistic, one-sided or two-sided p-value, unpooled confidence interval, and decision wording.
🎯A/B Test Presets
🧮Experiment Inputs
Context changes the interpretation wording, not the z-test formula.
Choose one-sided only if the direction was planned before the test.
The decision card compares the p-value with this alpha.
CI uses unpooled SE, separate from the pooled z-test SE.
Successful outcomes in version A or control.
Total eligible observations exposed to control.
Successful outcomes in version B or variant.
Total eligible observations exposed to variant.
🔢Current Test Snapshot
📐Formula Breakdown
📋Preset Comparison Grid
| Scenario | Control x/n | Variant x/n | p1 | p2 | Lift | Tail | Typical Read |
|---|---|---|---|---|---|---|---|
| Checkout CTA lift | 510 / 5000 | 620 / 5000 | 10.20% | 12.40% | +2.20 pp | Two-sided | Standard conversion win screen |
| Pricing page trial | 188 / 2400 | 221 / 2380 | 7.83% | 9.29% | +1.46 pp | Greater | Directional growth hypothesis |
| Email signup form | 780 / 8200 | 825 / 8100 | 9.51% | 10.19% | +0.68 pp | Two-sided | Small lift, large traffic |
| App onboarding step | 940 / 3000 | 1035 / 3020 | 31.33% | 34.27% | +2.94 pp | Greater | Activation improvement |
| Landing headline test | 420 / 6000 | 438 / 6100 | 7.00% | 7.18% | +0.18 pp | Two-sided | Likely inconclusive |
| Retention prompt | 1250 / 4200 | 1326 / 4225 | 29.76% | 31.38% | +1.62 pp | Greater | Returning-user action |
| Rare purchase event | 42 / 12000 | 59 / 12100 | 0.35% | 0.49% | +0.14 pp | Two-sided | Sparse event caution |
| Variant harm signal | 690 / 5200 | 612 / 5150 | 13.27% | 11.88% | -1.39 pp | Less | Variant lower than control |
| Small sample pilot | 18 / 140 | 27 / 145 | 12.86% | 18.62% | +5.77 pp | Two-sided | Wide CI, learn only |
🧭p-value Decision Reference
| p-value Range | Alpha 0.05 Decision | CI Pattern | Plain Reading | Next Check |
|---|---|---|---|---|
| Below 0.001 | Reject H0 | Usually far from 0 | Very strong statistical evidence | Check guardrails and bias |
| 0.001 to 0.009 | Reject H0 | Usually excludes 0 | Strong evidence of a rate difference | Estimate practical lift |
| 0.010 to 0.049 | Reject H0 | Often excludes 0 | Statistically significant at 5% | Confirm test assumptions |
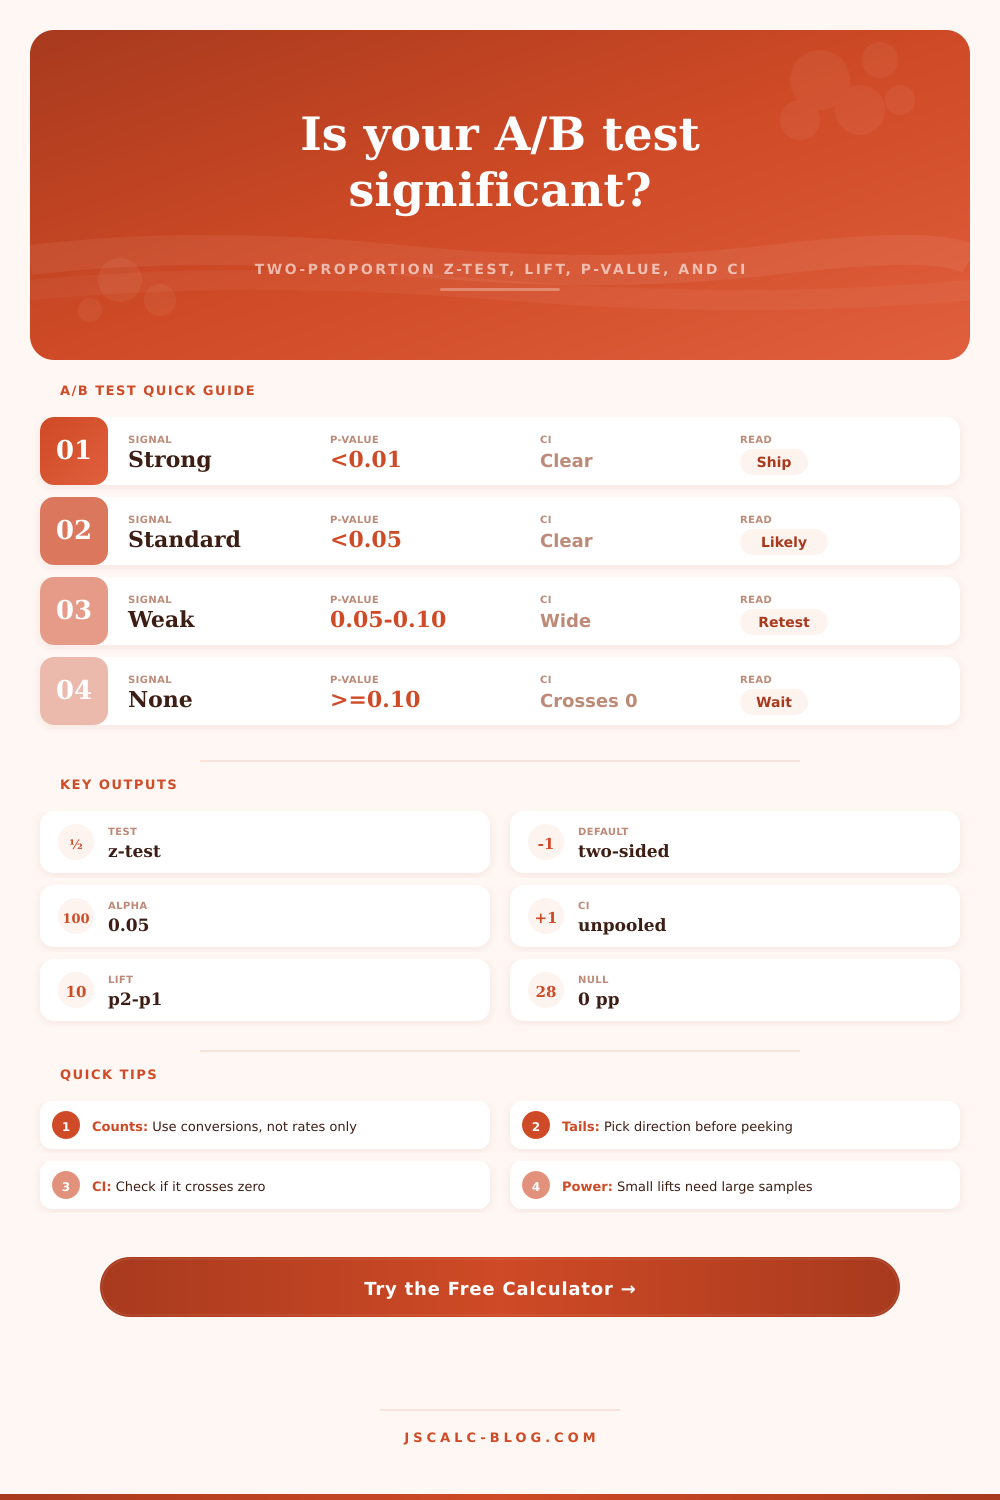
| 0.050 to 0.099 | Do not reject at 5% | May barely cross 0 | Suggestive but not conventional | Avoid overclaiming |
| 0.100 to 0.500 | Do not reject | Usually crosses 0 | Weak evidence of a difference | Review power and duration |
| Above 0.500 | Do not reject | Often centered near 0 | Observed split is close to noise | Stop or redesign |
⚖Test Tail and Confidence Choices
| Choice | Critical Value | Best Use | Main Caution | Calculator Setting |
|---|---|---|---|---|
| Two-sided alpha 0.05 | 1.960 | Default A/B significance report | Needs stronger evidence than one-sided | Variant differs |
| One-sided alpha 0.05 | 1.645 | Pre-planned improvement test | Invalid if chosen after seeing result | Higher or lower |
| 90% confidence interval | 1.645 | Exploratory interval | Narrower, less conservative | 90% |
| 95% confidence interval | 1.960 | Common reporting interval | Still approximate for sparse counts | 95% |
| 99% confidence interval | 2.576 | Strict decision review | Wider interval may cross zero | 99% |
| Unpooled CI SE | Varies | Rate difference uncertainty | Different from pooled test SE | Automatic |
🔍A/B Test Quality Checks
| Check | Good Sign | Risk Sign | Why It Matters | What To Do |
|---|---|---|---|---|
| Expected counts | At least 5 successes and failures per arm | Very rare or near-100% events | Normal approximation can be rough | Use exact or simulation backup |
| Traffic split | Random assignment stayed stable | Large unexplained imbalance | Assignment bugs can bias rates | Audit exposure logging |
| Peeking control | Decision rule set before launch | Repeated checks with no adjustment | Inflates false positives | Use sequential methods if peeking |
| Independence | One user contributes once | Same user counted repeatedly | SE assumes independent observations | Analyze at the unit randomized |
| Practical lift | CI entirely meaningful | Tiny lift despite low p-value | Large n can detect trivial changes | Compare CI with minimum effect |
| Guardrails | Primary win does not hurt key metrics | Conversion win harms quality | Single metric can mislead | Review holdout metrics |
💡Practical Significance Tips
On your dashboard, you see that the variant conversion rate is higher then the control rate. Looks like a winning test! The numbers look good and you’re itching to ship the change.
Statistical significance is what distinguishes a real insight from mere lucky fluke; it doesn’t pay for servers, and it doesn’t pay by gut feeling. The math can be daunting but the calculator above do it for you. It takes raw counts and turns them into confidence interval and p-values. No need to go through the math yourself.
What is Statistical Significance?
That’s where things get confusing. Because we don’t care about which number wins; we only care if that winning number stand out enough to be meaningful. This tool does that for you. It takes in your numbers for visitors, conversion count, and then uses a pooled standard error calculation to calculate the probability of getting this gap if null hypothesis held. In other words, if there were really no difference between these two group, what is the probability that we’d see this gap purely due to chance?
A low number indicates the chance of randomness are pretty low. A high number suggests you’re seeing a random result, not a breakthrough.
Too many team make this mistake: they quit the test when they see a spike, claiming victory. This increases false positives. The page has some reference tables that explains what each range of p-values means. Generally speaking, anything under 0.05 count as “significant.” Anything under 0.01 provides even stronger evidence.
Make sure you stick with your planned sample size. Don’t run a test until it becomes significant. That’s a logical trap, it’ll lead to bad decisions.
The formula doesn’t change, but context do. What does it mean? A one-sided test examine whether an outcome is better or worse, and seeks out that specific answer. A two-sided test find anything different. This is a decision you make before launching the test. Do not decide after seeing the data; that’s cheating the system. In the calculator, there is switch to flip between these settings. Your honor rests in being truthful from the start regarding what you hypothesize.
Don’t have a clue which direction the results might point? Stick with the two-sided version. That’s the safe bet.
There’s also the issue of sample size with A/B testing. With small samples, the confidence intervals is wide. This means that your actual lift could end up being huge (a great win!) or really negative (a major fail!). For example, the tool outputs an unpooled confidence interval displaying range. And if that range includes zero, then you can’t be sure the variant is actualy better. Perhaps you simply need more traffic.
To capture small lifts, you’ll need big samples. For example, trying to confirm a 1% boost with a thousand visitors will probably lead to a lot of frustration.
Statistical significance is one thing, but practical significance is another. It’s possible to have a small p-value that mean the result is statistically significant. However, the lift could be so small that it wouldn’t of been worth the engineering effort. Look at the absolute lift and consider whether it will help your business. If there is a 0.1% improvement on conversion, it may be statistically significant. But it isn’t likely to be worth changing. Consider the rigor of the math against what you can do given your resources.
There’s also a problem with testing rare events such as expensive purchases. Normal approximations doesn’t work well for that, because there aren’t many of them. When your counts are really small, the results won’t be quite so trustworthy. In that situation, you may need a more advanced solution.
This tool is strong enough to provide a solid answer for typical conversion tests. It presents you with the lift, the z-statistic, and the p-value all at once.
At the end of the day, A/B testing is all about learning. It is less important to decide between the variant and the control than it is to understand user behavior well enough to take action. You’re attempting to decrease uncertainty one way or another. Respect the sample size and use the data. Don’t fall for a lucky spike that convinces you you’ve discovered a perfect solution, the math will save you from yourself.