A/B Test Sample Size Calculator
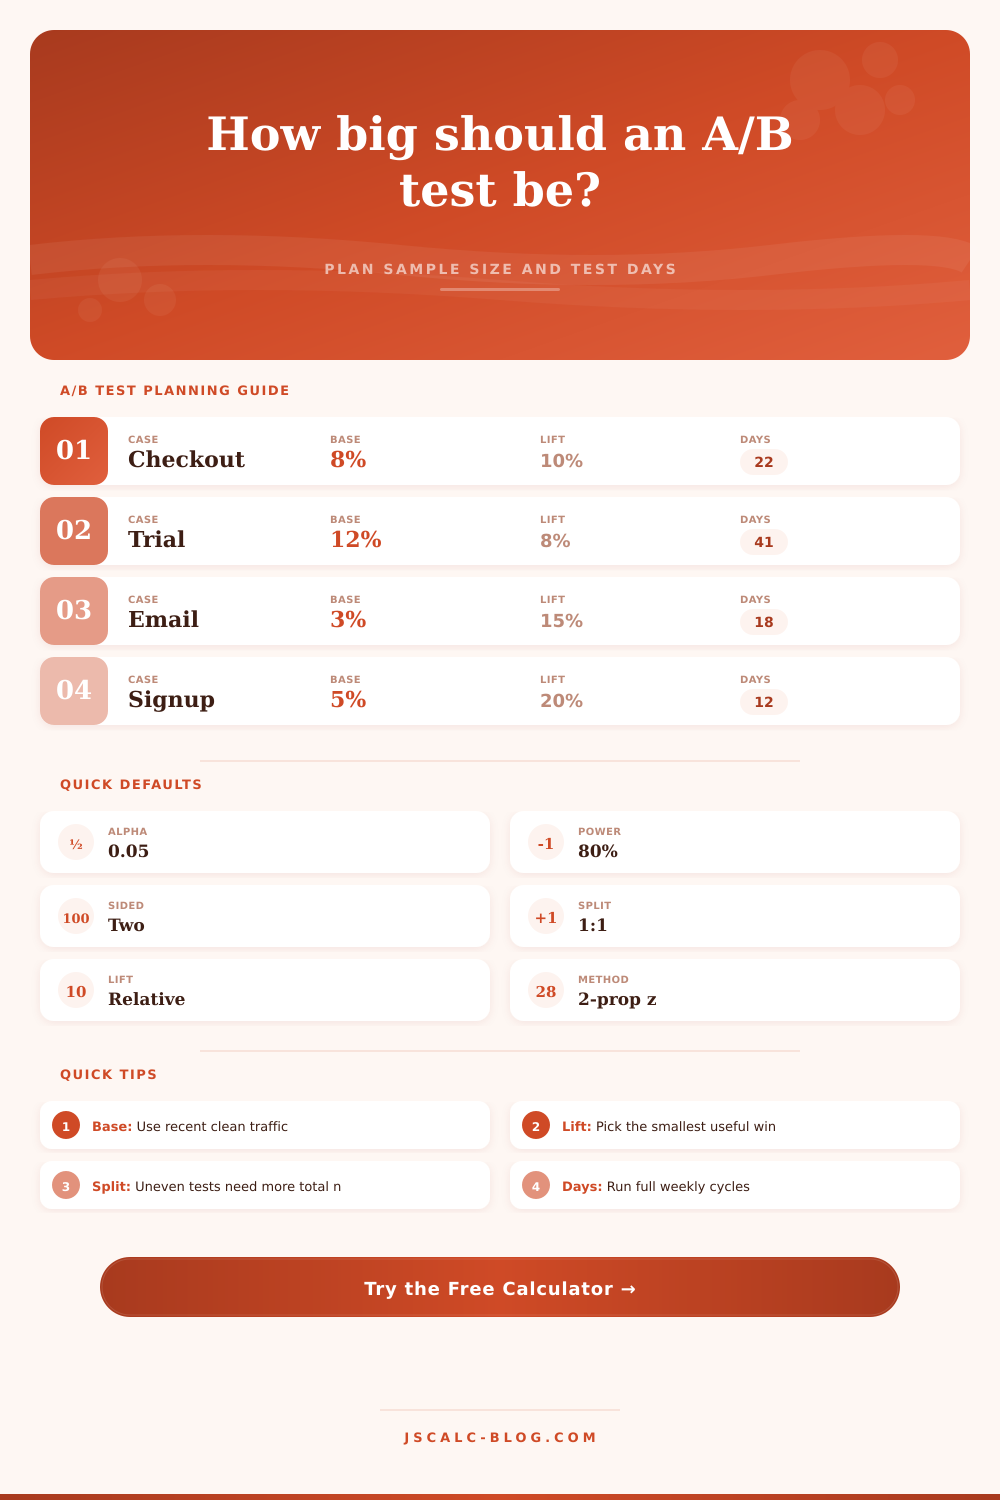
Estimate how many visitors each variation needs to detect a conversion-rate lift with a two-proportion z-test, then translate the plan into traffic days.
| Preset | Channel | Baseline | Lift | Daily traffic |
|---|---|---|---|---|
| Checkout CTA | Ecommerce | 8.0% | 10% rel | 5,000 |
| Product Photos | Ecommerce | 4.5% | 12% rel | 3,200 |
| SaaS Trial | SaaS | 12.0% | 8% rel | 2,000 |
| Pricing Page | SaaS | 6.0% | 15% rel | 1,400 |
| Email Subject | 3.0% | 15% rel | 12,000 | |
| Email CTA | 5.0% | 0.8 pt | 9,000 | |
| Cart Recovery | Ecommerce | 9.5% | 7% rel | 4,500 |
| Lead Form | SaaS | 2.8% | 20% rel | 2,800 |
| Onboarding Prompt | SaaS | 18.0% | 5% rel | 1,100 |
| Newsletter Signup | 7.0% | 1.0 pt | 6,500 |
| Lift case | Variant rate | Control n | Variant n | Total n |
|---|---|---|---|---|
| Calculate to fill this table. | ||||
The sensitivity table keeps alpha, power, sidedness, allocation ratio, and baseline fixed while changing the lift size.
| Daily eligible traffic | Control per day | Variant per day | Total days | Weekly cycles |
|---|---|---|---|---|
| Calculate to fill this table. | ||||
Days use total eligible traffic entering the experiment, then split it by the chosen nB/nA allocation ratio.
| Symbol | Meaning | How it is set | Notes |
|---|---|---|---|
| p1 | Control conversion | Baseline input / 100 | Must be between 0 and 1 |
| p2 | Variant conversion | p1 plus lift | Relative or absolute lift |
| k | Allocation ratio | nB divided by nA | 1 means equal split |
| pbar | Pooled planning rate | (p1 + k*p2) / (1+k) | Used in alpha term |
| z alpha | Significance cutoff | One- or two-sided alpha | Two-sided uses alpha/2 |
| z power | Power cutoff | Inverse normal of power | 80% power is about 0.842 |
| nA | Control sample | Two-proportion z formula | Rounded up |
| nB | Variant sample | k times nA | Rounded up |
For allocation ratio k = nB/nA, this calculator uses nA = ((z alpha * sqrt((1 + 1/k) * pbar * (1 - pbar)) + z power * sqrt(p1(1-p1) + p2(1-p2)/k)) / (p2 - p1)) squared.
When you test something and you notice a slight increase in conversions after 3 days when you launch a new checkout page, you’ll feel relieved. It’s a win! Or so you think. Chances are that sample size were too low for you to believe anything. What you observed was probably just statistical noise, you’re not seeing a true signal.
Sample size should of been planned for BEFORE you begin testing. Unfortunately, most people thinks about sample size as an afterthought. However, sample size is foundation of any valid experiment. Guessing with your company’s revenue is exactly what you’re doing if you don’t consider sample size.
How to Plan the Right Sample Size for Your Tests
How many data points do I need before I know if it was a real improvement or just random chance? Adjusting for traffic volume, power and confidence levels gets messy. That’s where the calculator comes in. Enter some numbers and it does heavy lifting of converting abstract probabilities into concrete numbers (calendar days & visitors). It is easier to talk about with your stakeholders who think in terms of resources & timelines.
First, look at your conversion rate baseline. It shouldn’t be based off a hunch; rather, pull it from recent (clean) traffic data. If you use historical data that are messy or from different time of year, your inputs will be wrong. Use bad data and your results will mislead you.
Second, determine your minimum detectable effect. This is the challenge of the exercise. How much of a lift actualy matters to your business? Don’t waste traffic trying to detect something that a one percent increase wouldn’t change your mind about launching. The smaller the lift, the exponentially larger the sample size needed. Tests can drags on for months this way.
The guard rails of your experiment are power and significance. Significance (or alpha) controls the risk that you’ll have a false positive, declaring victory where there’s no victory. Power (beta) controls the risk of having a false negative; missing a true win due to an underpowered test. Reasonable defaults for most team are five percent alpha and eighty percent power. That’s fine to start with. What matters is realizing that you have to collect more data if you want to tighten these parameters. Needing ninety-five percent power? You’re going to be looking at a lot more visitors before you can feel confident about it.
Surprisingly, even how traffic gets allocated matter. Statistically speaking, splitting it down the middle (fifty-fifty) makes the most sense. If you’re experimenting with something risky, you may want to route more to the control group. Splitting unevenly raises the number of visitors needed per arm in order to achieve the same level of accuracy. That’s a matter of both statistical efficiency vs. It is a matter of risk management. The tool will take that into account for you. Based on your selected ratio, it’ll determine how many people you need.
Turn those figures back into time once you have the numbers. Four weeks to acquire ten thousand visitors sounds much more meaningful than “I need ten thousand visitors.” Round to whole weeks so you’re not throwing off your results due to weekend/weekday variances. Running a test for only three days means you may miss Tuesday’s conversion dip, or Saturday’s surge. Weekends matter. There’s a reason they follow a pattern every week. Failing to adjust for this introduces bias which even the most powerful statistics cannot fix.
To be clear, a sample size calculator is a planning tool, not a crystal ball. It provides you with a target, but what you do next depends on how you treat the data. Don’t peek at the result and end your test early when you see who wins. That’s called peeking and nullifies the significance levels you worked so hard to plan. Run the test until completion. Trust the math you planned and use full data sets to drive decision making. It’s boring but it works.