Chi-Square Test of Independence Calculator
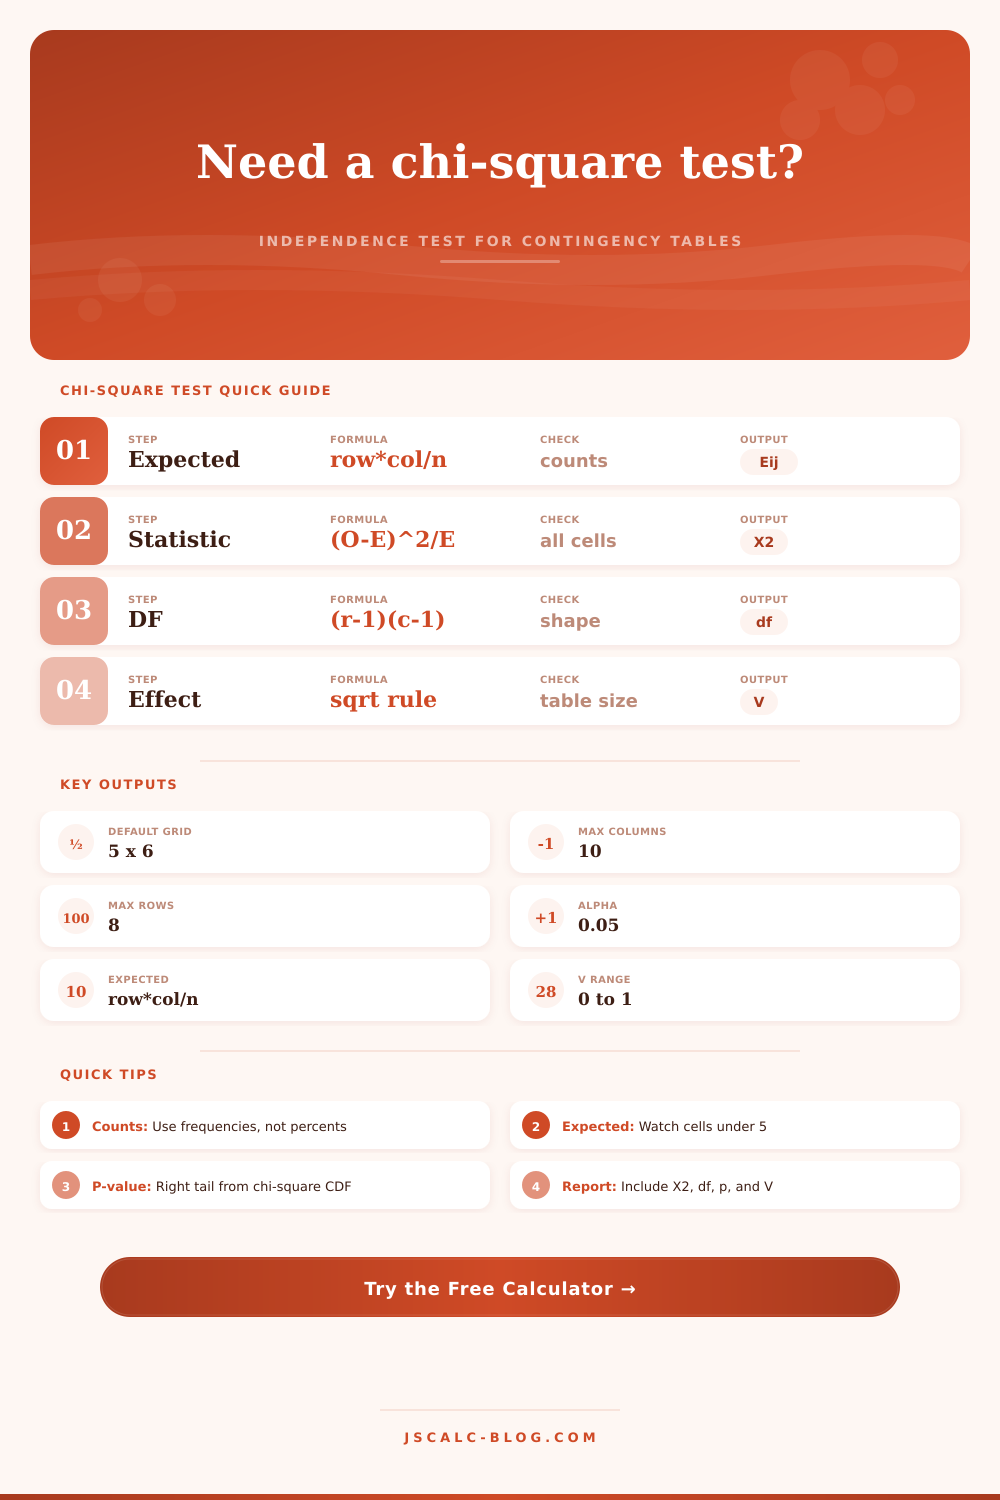
Test whether two categorical variables are independent using observed counts, expected counts, Pearson chi-square, degrees of freedom, p-value, and Cramer's V.
📌 Presets
📝 Test Inputs
Use comma, tab, or space separated counts. Rows are separated by line breaks. The default grid is 5 x 6 and can expand to 8 x 10.
🔢 Observed Counts Grid
Enter observed frequencies only. Do not enter percentages, averages, ranks, or expected values.
🧪 Diagnostics
📋 Tables
Observed counts include row totals, column totals, and the grand total.
Expected count for each cell equals row total × column total / grand total.
Contribution cells show (observed - expected)² / expected and sum to the chi-square statistic.
Standardized residuals show direction and strength by cell; larger absolute values are the main drivers.
📐 Formula Notes
💡 Tips
With the chi-square test of independence, for example, you can tell whether your marketing channels and customer regions is connected. Perhaps you’ve got some information about where customers come from (social media? Maybe you have information about whether they came from social media or email, and you also have information about which region they livin in. The chi-square test lets you know whether the two variables are related, or whether it’s just random chance.
It compares a table of numbers and reveals what is statistically significant and what isn’t. You don’t need to be a math whiz to use the chi-square test, but you should of had an idea of how to interpret it. The expected frequencies is computed by the calculator. This is what you’d expect to find without a relationship between the variables.
How to Use the Chi-Square Test
The further away your actual findings deviate from this expectation, the larger the test statistic are. The larger your chi-square, the more likely it is that your variables are related. If your number is small, then they’re probably not. Keep in mind: the test statistic doesn’t quantify how strong the relationship might be, just whether it exists at all. There’s no correlation measurement here.
Check the expected count rule. Does the sample size allow you to run the math? When you have too many cells with small expected values, it make the numbers junky. The diagnostics section will flag this. Ideally you’d like at least 80% of your cells to have an expected count of five or more. This will help keep your conclusions honest. Violating this rule can cause false positives.
A p-value represents the probability of observing your data given the null hypothesis is true. In practice, we typically use a alpha of.05. Therefore, if your p-value is less than.05, then it means there is less than a 5% chance of finding what you found if the null was actualy true. That would lead us to reject the idea that your two variables are independent of each other.
However, rejecting the null is just part of the story. We also want to know how strong the relationship is. This is where Cramer’s V comes in. It scales the results from zero to one. This allows us to see an effect size that isn’t distorted by our sample size. A small p-value accompanied by a small V could lead us astray. Perhaps we have a very large sample which has identified a difference that may not matter much at all.
If you dig down into an individual cell, you’ll see even more detail. The contribution table tell you what categories are driving the result. In one region they may love email marketing but in another they completely ignore it. Sometimes that’s going to be the make-or-break cell for your whole test. The standardized residuals tells you where the observed count varies the most from the expected count. Dig around in there if something doesn’t look right. It’s far better than being given a simple yes or no.
In the real world, data is never clean. There may be small samples. Groups aren’t balanced. It has various ways of adjusting for that. It gives you options for what counts it expects and lets you paste your matrix right in so you don’t waste time. The presets are great because they let you see how the math applies in common scenarios such as ratings at a clinic.
Be careful how you report results. You should report the chi-square statistic, degrees of freedom, p-value, and effect size. That provides a complete picture for those who read what you write. They can evaluate practical impact different than statistical significance. The degrees of freedom depend on the shape of your table, specifically the number of rows and columns. The more rows and columns, the greater the degrees of freedom. It impacts the distribution of the test statistic. Explain the structure so they understand why it matters.
Finally, the test tests your pattern assumptions. We tend to think we see things that aren’t actually there. The chi-square test is a kind of reality check. Does what we see really matter? Or are we merely wishing it were true?
Running this in combination with cell level analysis and effect size create a more nuanced picture. It changes “guessing” to “knowing”. Hopes don’t matter when doing the math, only the counts do.