Capital Adequacy Ratio Calculator
Measure a bank's Basel III strength: enter CET1, Additional Tier 1, and Tier 2 capital against risk-weighted assets to get the Total Capital Ratio, CET1 ratio, Tier 1 ratio, capital surplus, and pass or fail versus regulatory minimums.
🎯Real Bank Presets
📝Capital & Risk Inputs
Highest quality capital: common shares plus retained earnings.
Perpetual instruments such as contingent convertible bonds.
Subordinated debt and eligible loan-loss reserves.
Used when entry mode is single total RWA.
Used when standard is set to custom minimum.
Added on top of the selected total requirement.
🔢Formula Snapshot
📊Basel III Minimum Requirements
| Capital Ratio | Base Minimum | + Conservation Buffer | Your Ratio | Status |
|---|---|---|---|---|
| Enter values above to compare against Basel III minimums. | ||||
🧱Capital Tier Composition
| Capital Layer | Amount ($M) | Share of Total | Ratio to RWA | Quality |
|---|---|---|---|---|
| The tier composition appears after calculation. | ||||
⚖Risk-Weight Reference Table
| Asset Class | Risk Weight | Example Exposure | RWA per $100 |
|---|---|---|---|
| Cash and central bank reserves | 0% | Vault cash, reserves | $0 |
| Domestic sovereign (AAA to AA-) | 0% | Government bonds | $0 |
| Sovereign (BBB+ to BBB-) | 50% | Lower-rated govt debt | $50 |
| Sovereign (below B-) | 150% | Distressed sovereign | $150 |
| Bank exposures (rated A) | 30% | Interbank claims | $30 |
| Residential mortgages (low LTV) | 35% | Prime home loans | $35 |
| Residential mortgages (higher LTV) | 50% | Standard home loans | $50 |
| Corporate exposures (investment grade) | 65% | Rated corporate loans | $65 |
| Corporate exposures (unrated) | 100% | SME and general loans | $100 |
| Retail and credit cards | 75% | Consumer credit | $75 |
| Commercial real estate | 100% | Income-producing CRE | $100 |
| Past-due exposures (>90 days) | 150% | Non-performing loans | $150 |
| Equity holdings (listed) | 250% | Significant equity stakes | $250 |
🏷Regulatory Rating & PCA Categories
| Category | Total CAR | Tier 1 Ratio | CET1 Ratio | Supervisory Meaning |
|---|---|---|---|---|
| Well capitalized | ≥ 10% | ≥ 8% | ≥ 6.5% | No restrictions, strong buffer |
| Adequately capitalized | 8% – 10% | 6% – 8% | 4.5% – 6.5% | Meets minimums, limited buffer |
| Undercapitalized | 6% – 8% | 4% – 6% | 3% – 4.5% | Corrective action, capital plan |
| Significantly undercapitalized | 4% – 6% | 3% – 4% | < 3% | Restrictions, forced raise |
| Critically undercapitalized | < 4% | < 3% | < 2% | Receivership risk within 90 days |
🗂Bank Scenario Comparison Grid
| Scenario | CET1 / T1 / T2 ($M) | RWA ($M) | CET1 % | Total CAR | Standing |
|---|---|---|---|---|---|
| Well-capitalized bank | 9,000 / 10,500 / 2,500 | 100,000 | 9.0% | 13.0% | Well capitalized |
| Basel III minimum | 4,500 / 6,000 / 2,000 | 100,000 | 4.5% | 8.0% | Adequate |
| With conservation buffer | 7,000 / 8,500 / 2,000 | 100,000 | 7.0% | 10.5% | Meets buffer |
| Under-capitalized | 3,600 / 4,800 / 1,500 | 100,000 | 3.6% | 6.3% | Undercapitalized |
| Large retail bank | 62,000 / 72,000 / 18,000 | 640,000 | 9.7% | 14.1% | Well capitalized |
| Community bank | 140 / 165 / 40 | 1,400 | 10.0% | 14.6% | Well capitalized |
| High RWA load | 9,000 / 10,500 / 2,500 | 150,000 | 6.0% | 8.7% | Adequate |
| Global SIB | 180,000 / 205,000 / 45,000 | 1,500,000 | 12.0% | 16.7% | Well capitalized |
⚙Full Formula Breakdown
📋Reference Values
| Measure | Basel III Rule | How It Is Used | Effect on CAR |
|---|---|---|---|
| CET1 minimum | 4.5% of RWA | Highest quality loss buffer | Floor for the core ratio |
| Tier 1 minimum | 6.0% of RWA | CET1 plus AT1 instruments | Going-concern threshold |
| Total capital minimum | 8.0% of RWA | All eligible capital | Headline solvency floor |
| Conservation buffer | 2.5% CET1 | Sits above the minimums | Raises effective needs |
| Tier 2 eligibility cap | ≤ 100% of Tier 1 | Limits gone-concern capital | Excess is excluded |
| G-SIB surcharge | 1.0% to 3.5% CET1 | Extra buffer for large banks | Raises total requirement |
💡Practical Capital Tips
A tall building is no indicator of its strength; you’d need to see the foundations for that. Similarly, investors can not assess a bank’s balance sheet without adjusting for risk. Simply seeing its size, i.e., the amount of loans it holds… Tell you absolutely nothing about if these loans are safe. That’s where the capital adequacy ratio comes into play. It removes vanity metrics and shows us precisely how much real damage an institution could take before it goes bust.
This gets at what’s going on. Some assets is more equal than others. While a speculative venture capital investment involves tremendous uncertainty, a loan made to the federal government present nearly no risk. That’s the basic concept, and it is powerful. Plug those numbers into the calculator and let it do the math for you. Let it change the raw value of your assets into risk-weighted numbers that reflect their real danger.
How Capital Makes Banks Safe
Why? Because two banks with the same volume of loans could require vastly different levels of capital. And that difference hinges on who they lent money to and how they managed market volatility. This safety net is funded by three layers of capital within banks.
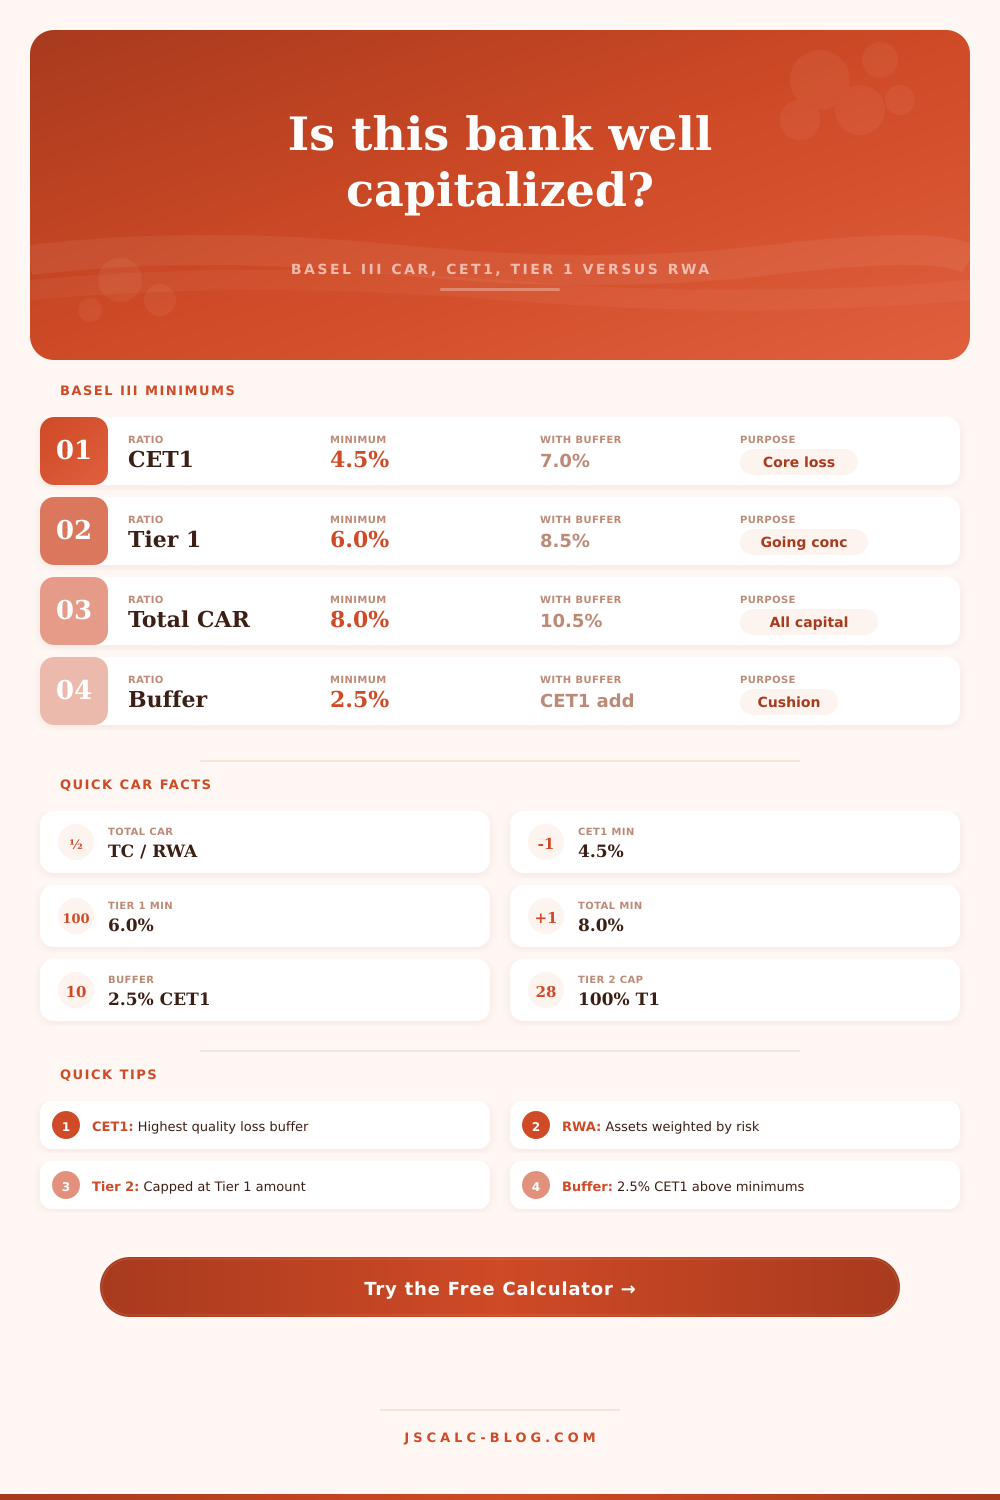
First is Common Equity Tier 1. This is the best quality money in the house. It’s made up of retained earnings plus common shares. That is, it’s equity or real cash from shareholders that would be lost if things don’t works out. This is a shock absorber when the bank are still operating.
Next is the addition of perpetual bonds and other hybrid instruments. They’re a little more inflexible but will keep the bank going with further losses. Last is Tier 2 capital, which is a failure buffer. If the bank does fail and goes into liquidation, then it matters. Each layer has a minimum requirement enforced by regulators.
According to the new Basel III standard, a bank must hold at least 4.5% CET1 and 8.0% total capital compared to its risk-weighted assets. The catch is that most people get tripped up here. That’s only the floor. On top of the minimums, there’s a 2.5% conservation buffer. In effect, this raises the bar to 7.0% CET1 (core equity) and 10.5% total capital.
If a bank touches this buffer, it will automatically be restricted from bonus/bonus payments or dividends. It’s not an accident; regulators desire for banks to set aside their earnings in the good years so that they’ll still have some fuel remaining during bad years. To know what’s in the bag matters as much or more than knowing the overall percentage. That 10% total capital ratio your bank boasts sounds robust, until you realize most of it consist of crappy Tier 2 debt (which isn’t nearly so solid).
This chart shows how different asset classes contribute to their risk weight. Why does a cash reserve-heavy portfolio require less of a safety margin than an overweight position in commercial real estate? Always look at the CET1 number first; that will give you a sense of whether the bank has its own money at risk. These ratios can get really complicated with adjustments that move against the economic cycle and special buffers for globally systemic important banks. Doing the math yourself would of been time-consuming and easily wrong.
By contrast, this tool allows you to plug in your own risk profile and your actual levels of capital. Then, based off regulatory rules, it shows you if you’re undercapitalized or overcapitalized relative to requirements. And it highlights whether you’re well capitalized or undercapitalized. In short, students (and analysts) can see that having more cash isn’t what makes a bank safe. Rather, a bank’s safety comes from its level of good quality loss-absorbing capacity against the risks it has chosen to take on.
At its core, then, this is all about resilience; capital adequacy helps make sure you have a sufficient buffer in case something unexpected occurs, without panicking. The same rules apply whether your company is a global financial giant or a small-town community bank. Tall buildings won’t save you; it’s what they’re built upon that counts.
What’s the real weight of the risk? How strong is their capital? That’s where you get to know the institution for who they actualy are. It isn’t about how they want to be seen.