Billable Utilization Rate Calculator
Calculate billable utilization from actual billable hours, available working hours, time off exclusions, target utilization, team size, and realization rate.
📌Presets
🧮Utilization Inputs
Used for benchmark context; the calculator still uses your entered hours.
Billable utilization usually divides by available working hours after planned time off.
Use 100% when every recorded billable hour is fully realized.
Utilization Results
🗂Comparison Grid
📋Utilization Benchmark Table
| Team or role | Common target range | Why the range differs | Watch metric |
|---|---|---|---|
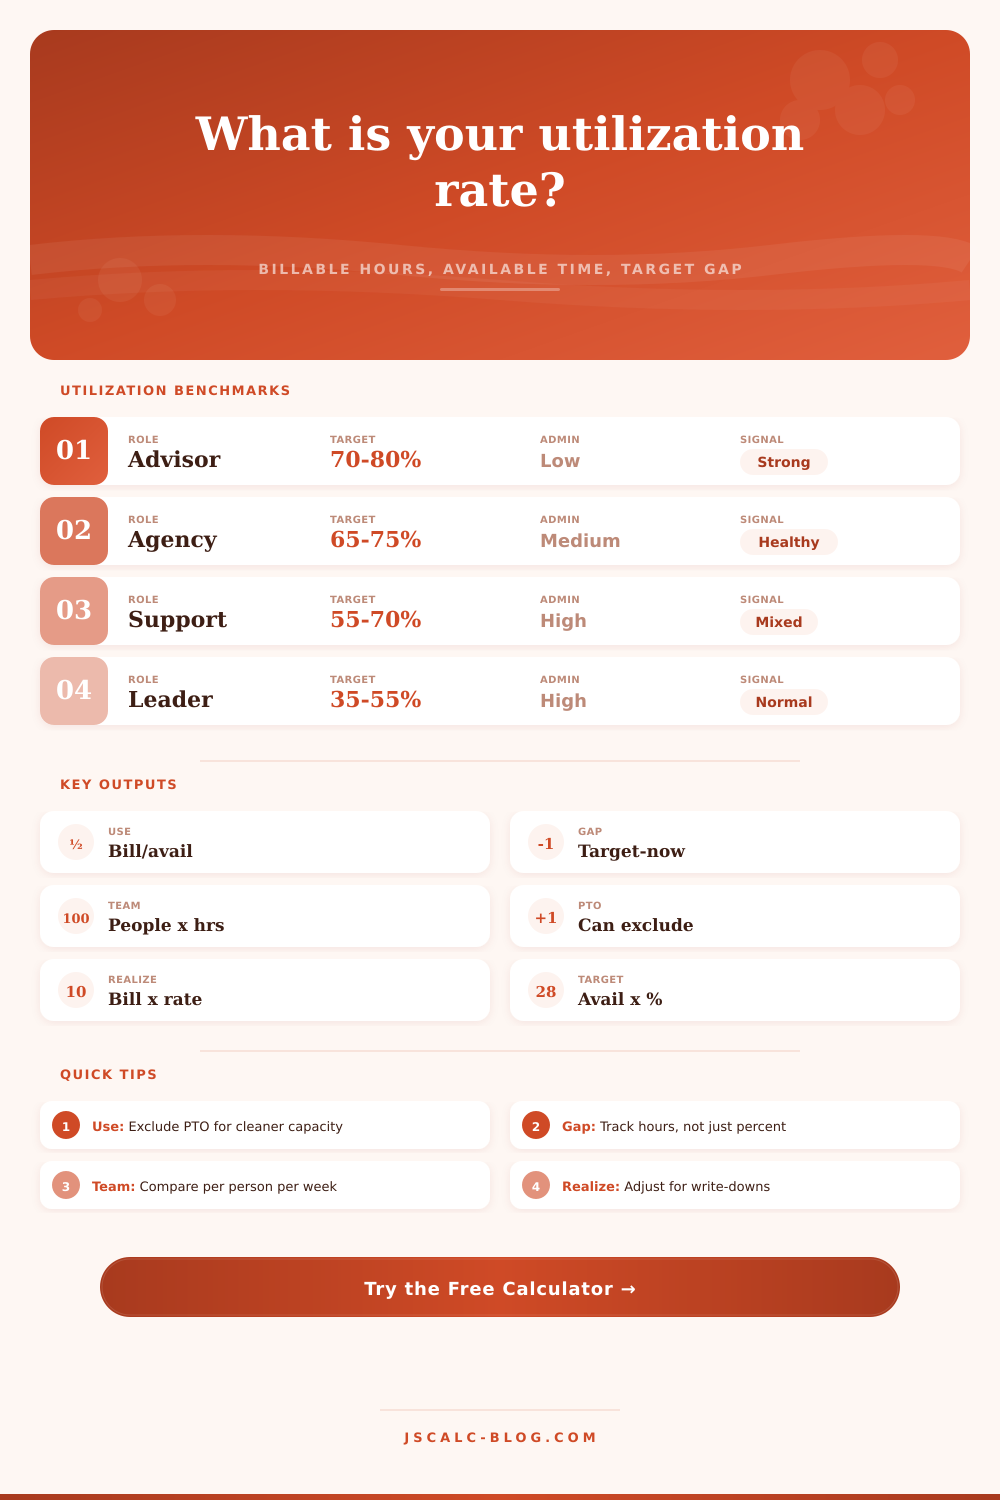
| Client advisory consultant | 70% to 80% | Mixes delivery, prep, and account growth | Target gap hours |
| Creative or marketing agency | 65% to 75% | Internal reviews and campaign planning take capacity | Billable per person |
| Legal or accounting professional | 75% to 85% | Time tracking is often task-level and matter-based | Realization rate |
| Managed service support pod | 55% to 70% | Coverage, triage, and monitoring create standby time | Available hours |
| Delivery manager or principal | 35% to 55% | People leadership and sales support reduce billable mix | Role-specific target |
| Implementation or productized service team | 68% to 78% | Repeatable delivery supports a higher billable share | Realized utilization |
📅Available Hours Basis
| Capacity step | Formula | Included in denominator? | Useful when |
|---|---|---|---|
| Gross scheduled capacity | People × weeks × weekly hours | Yes, before adjustments | You need total calendar capacity |
| PTO and holidays | People × days off × daily hours | No, if excluded | You want true working availability |
| Admin and internal work | People × weeks × admin hours | Yes | You want utilization to expose internal load |
| Available working hours | Gross hours minus excluded time off | Yes | You compare actual billable to work time |
📐Formula Breakdown Table
| Metric | Formula | Interpretation | Result direction |
|---|---|---|---|
| Utilization % | Billable hours / available working hours × 100 | Share of available time recorded as billable | Higher means more billable mix |
| Target billable | Available working hours × target % | Billable hours needed for the target rate | Sets the target line |
| Target gap | Target billable - actual billable | Positive means extra billable hours are needed | Zero means target met |
| Realized utilization | Billable hours × realization / available hours | Adjusts recorded billable time for write-downs | Lower than raw when realization is below 100% |
🔍Target Gap Examples
| Available hours | Target utilization | Target billable | Actual billable | Target gap |
|---|---|---|---|---|
| 480 | 70% | 336 | 315 | 21 hours short |
| 1,520 | 72% | 1,094 | 1,120 | 26 hours over |
| 3,600 | 75% | 2,700 | 2,520 | 180 hours short |
| 7,800 | 68% | 5,304 | 5,460 | 156 hours over |
| 12,000 | 60% | 7,200 | 6,840 | 360 hours short |
💡Utilization Tips
This one is familiar, you’ve been in the meeting: the team are bustling and you feel like revenue isn’t following suit. You see people joining meetings and responding to email, but you’re not seeing billable hours reaching your target. Typically this boils down to one metric, which is something most leaders fail to get right. They view how much time people spend directly billing clients as a raw percentage. This figure is nice and tidy. And it’s almost always incorrect.
But then there’s the other part… How much time do you think is available? Many companies falls into the trap of taking full number of clock hours in a workweek, assuming everyone sits at a desk all day long. Then they divide that number by billable hours. By doing this, they assume people are, well, human beings. Human beings who go on vacation. Hold internal meetings. They process paperwork that isn’t strictly billable but is necessary to get things done. If your denominator include unproductive time, you’re going to deflate your utilization rate. You’ll paint an otherwise healthy team as under-performing. And you’ll cause some panic that doesn’t need addressing.
How to Calculate Your Real Work Hours
Define what true available hours are, and the calculator above will do the math for you. It filters out planned days-off, holidays, etc. It shows a more accurat picture of true capacity.
Let’s take a step back and talk about gap between the target and reality. You don’t really learn much from a percentage number. Does a 7% decrease in use mean five missed hours a week? Or does it mean fifty? That depends on how many people is on your team. The tool gives you an answer in actual hours. It moves away from an abstract percentage to concrete staffing questions. Is the gap small enough that you could tweak schedule timing? Is it large enough that you should of consider hiring (or revisiting pricing)? Knowing your hours per week per person is much more useful than looking at a trend line across months. It makes you think about bandwidth, for each person, not just averages.
And then there’s realization rate. It is a low-key, but deadly, money-killer. Sure, you may have had great utilization numbers and accurate time tracking. But if you’re writing down hours because the client pushed back, or the scope creeped, you didn’t realy earn those hours. Realized utilization factors in this ugly truth: it multiplies your recorded billable hours by the percentage that will get invoiced and paid. Eighty percent utilization at full value is better then one-hundred percent utilization at only 80% realization. The calculator shows you that difference. And it protects you from congratulating yourself on doing busy work that won’t pay the bills.
You can’t expect the same from every job. If you ask a junior advisor to achieve the same use of time as a principal, they will burn out. Principals devotes hours to strategy, hiring, and sales. These are critical activities that almost never bill at the normal hourly rate. On the following page, we lay it out by job. Why legal professional log their time down to task level. Support staff may not meet their full target due to standby time. One benchmark will not work for all jobs. One benchmark skews the results. It punishes those doing the most critical non-billable work. Segment your workforce to get meaningful insights.
But it’s realy knowing what you’re measuring. Is that activity or efficiency? Because high use doesn’t necessarily equate with good. In fact, sometimes it means you’ve picked bad clients or that you haven’t innovated. When everyone is over-scheduled doing low-margin stuff, then they are putting themselves in danger. What you should strive for is lasting capacity. Want some cushion for growth. You want some cushion to make sure you deliver quality.
This will help you get there. It’ll show you how far you are from where you want to go. It’ll highlight the difference between where you are and where you want to be.
First, eliminate scheduled days off from your pool of hours. That’s the single largest adjustment most companies overlook. Next, enter number of hours you actually get to bill. See what happens when you plug in a realistic billing rate. See if you’re underperforming. You may discover you’ve been overstating your capacity all along.
Inputting the figures won’t lie. It will simply reflect the data you input. Input carefuly. You’ll see the light it shines on busy-work and other hidden costs. Solving these can fix more problems than even the most significant strategy shift. It shows what is actualy happening. That’s where true change starts.