Billable Hours Calculator
Estimate billable hours, utilization, revenue, nonbillable drag, and weekly, monthly, quarterly, or annual capacity from one clean planning model.
📌Billable Hours Presets
⚙Workload Inputs
Capacity is annualized from the selected period.
Only the symbol changes; hours math is unchanged.
Used for the utilization benchmark and target reading.
Use FTE equivalents when part-time staff are included.
Total scheduled work hours in the selected period.
Internal meetings, invoicing, status updates, and operations.
Sales support, proposals, bench time, and unpaid client work.
Learning, certification, mentoring, and practice development.
Hours not available because of PTO, holidays, or leave.
Blended client bill rate for the period.
Used to compare actual billable hours with target capacity.
Optional adjustment for write-downs, discounts, or collection gaps.
Formula Breakdown
📊Capacity Snapshot
📘Formula Reference
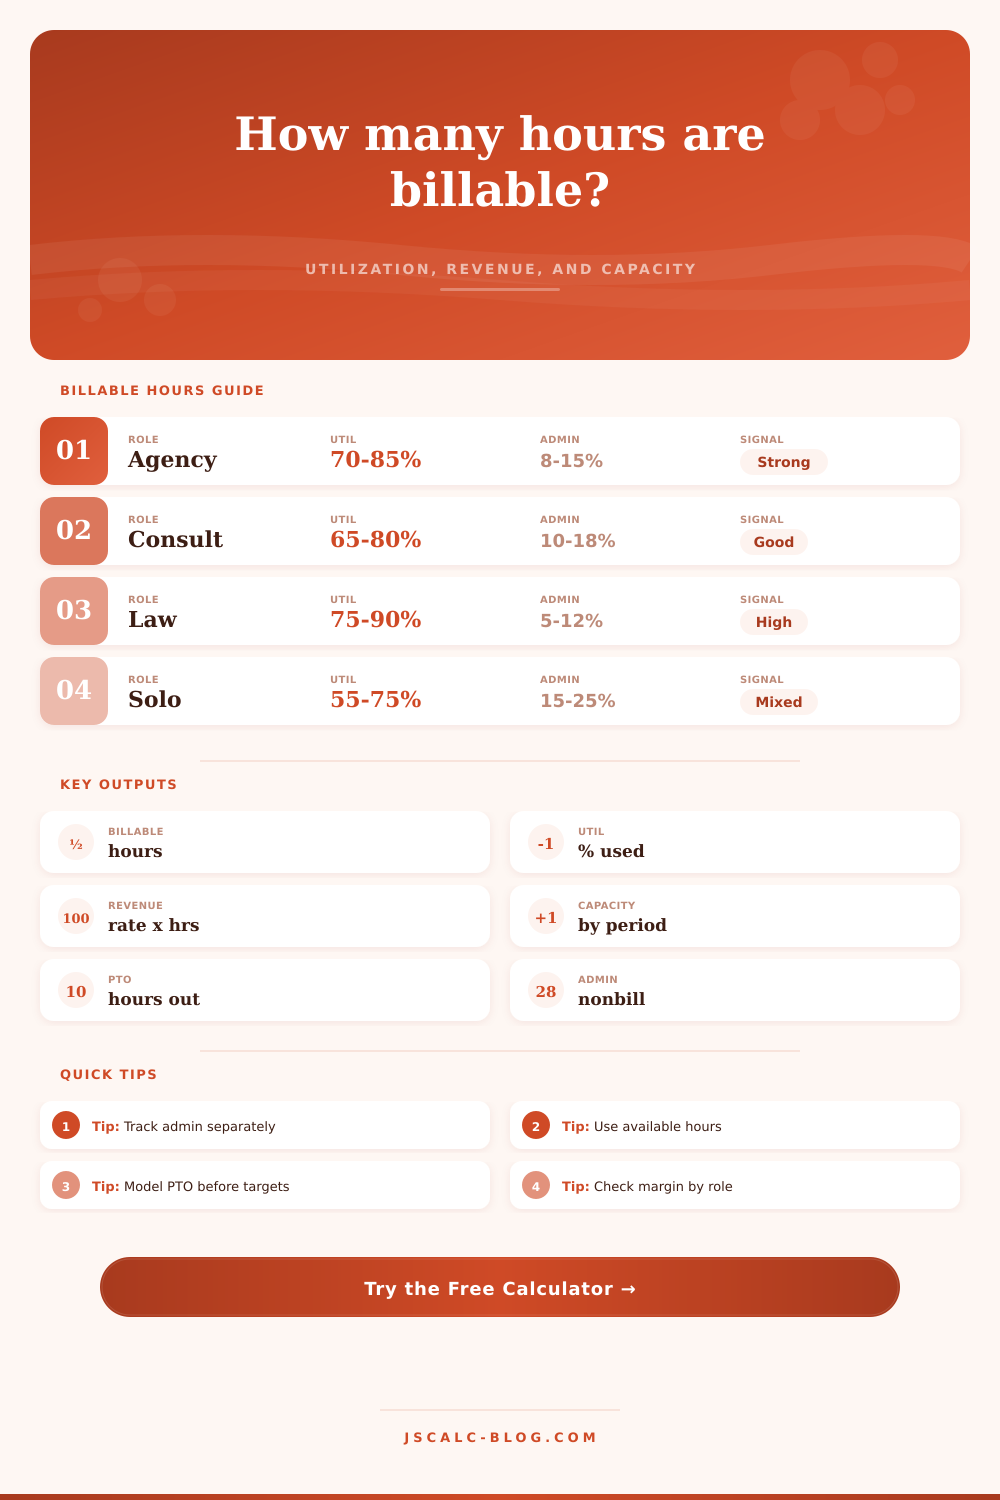
🗂Role Utilization Comparison Grid
| Role Profile | Common Target | Admin Load | Training Load | PTO Sensitivity | Capacity Signal |
|---|---|---|---|---|---|
| Agency or creative services | 70% to 85% | Moderate client coordination | Campaign and tool updates | Monthly targets move quickly | Watch scope and internal review time |
| Consulting practice | 65% to 80% | Proposals and account planning | Method and industry research | Quarterly view is cleaner | Bench time should be separated from delivery |
| Legal timekeeper | 75% to 90% | Lower if support staff absorb admin | CLE and matter learning | Annual targets are common | Realization matters as much as recorded time |
| Independent freelancer | 55% to 75% | High because one person does everything | Skill development competes with delivery | Vacation has a direct revenue drag | Use capacity before accepting retainers |
| Implementation team | 60% to 78% | Project rituals and handoffs | Product release learning | Peaks around go-live windows | Use sprint-level capacity checks |
| Managed services | 68% to 82% | Ticket triage and reporting | Runbook and platform training | Coverage planning is central | Compare utilization with SLA coverage |
| Accounting or advisory | 70% to 86% | Seasonal filing and review admin | Tax and standard updates | Seasonality can distort averages | Compare busy season with full-year capacity |
| Engineering services | 62% to 78% | Architecture and planning overhead | Stack and security learning | Team availability affects sprint scope | Track discovery separately from build work |
⏱Period Capacity Lookup
| Period | Hours Per FTE | Annual Factor | Use Case | Capacity Note |
|---|---|---|---|---|
| Week | 40 | 52 | Near-term scheduling | Best for PTO, holidays, and sprint planning |
| Month | 160 to 174 | 12 | Management reporting | Smooths weekly swings but still catches admin load |
| Quarter | 480 to 520 | 4 | Hiring and sales capacity | Good for target setting and staffing plans |
| Year | 1,920 to 2,080 | 1 | Annual goals and bonuses | Must include PTO and holidays before setting quotas |
| Custom FTE | User-entered | Selected factor | Part-time or mixed teams | Enter staff as FTE equivalents for cleaner math |
| Seasonal block | User-entered | Manual period choice | Tax season or project peaks | Use the period that matches how targets are reviewed |
📋Time Category Breakdown Table
| Time Category | Counts As | Calculator Input | Formula Treatment | Planning Check |
|---|---|---|---|---|
| Client delivery | Billable if chargeable | Remainder after deductions | Forms billable hours | Confirm the work can be invoiced or recognized |
| Admin | Nonbillable | Admin hours per person | Subtract from total work hours | Separate recurring meetings from one-time cleanup |
| Sales and proposals | Nonbillable or investment | Other nonbillable hours | Subtract unless client-paid | Track by pipeline stage when possible |
| Training | Nonbillable capacity use | Training hours per person | Subtract from total work hours | Keep ramp plans visible instead of hiding them in admin |
| PTO and holidays | Unavailable time | PTO and holiday hours | Subtract from total and available capacity | Model before utilization targets are assigned |
| Write-downs | Revenue realization issue | Realization rate | Adjusts revenue, not hours | Use realized revenue to spot pricing or scope friction |
📐Utilization Band Table
| Utilization Band | Meaning | Typical Cause | Revenue Effect | Next Check |
|---|---|---|---|---|
| Under 55% | Low billable load | Bench time, sales work, or weak demand | Revenue capacity is unused | Review pipeline, staffing, and admin drag |
| 55% to 69% | Flexible but watchful | Balanced sales and delivery or solo overhead | Works for mixed-role staff | Separate producers from managers |
| 70% to 84% | Healthy for many services teams | Strong delivery load with room for admin | Usually supports predictable revenue | Check burnout and quality review time |
| 85% to 92% | High load | Heavy client delivery or lean staffing | Revenue is high if realization holds | Watch rework, overtime, and PTO backlog |
| Over 92% | Very tight | Admin may be hidden or capacity is overfilled | Short-term revenue can hide delivery risk | Audit time coding and staffing coverage |
💡Billable Hours Tips
Most professionals selling time falls prey to a dangerous delusion. They think every hour they sit at their desk counts toward their own paycheck. This is the greatest leak in service business profits. While you have work hours, you don’t have billable hours. The difference between those two represent the source of profits or the death spiral of loss. To understand this difference takes us beyond the calendar and into the nuts and bolts of use. So let’s put some numbers into the calculator (above). It will do the math for you, but knowing what those inputs represent, that’s where the value comes from.
Typically, folks begin with total hours and work down from there. That’s backward. Begin with capacity. Then subtract the unavoidable drag. First deduction? PTO. People tend to underestimate their PTO. They think: “Oh yeah, I’ll be able to take two weeks off a year.” Then they remember: Oh wait, there are holidays… and those always fall on a Monday… and my kids gets sick at least once every month… and man, around Christmas everybody just checks out mentaly for a whole week. If you model PTO prior to setting targets, you avoid getting frustrated at missing your utilization goal while not being able to blame yourself.
The Truth About Billable Hours
This page has a reference table that lays it all out by role. The reference table on the page shows how legal firms handle leave different than creative agencies. Next up is the admin overhead. It is a quiet assassin. Time spent on meetings, billing, reporting status and learning stuff inside the company doesn’t create immediate revenue. But it can be tricky because knowing exactly how much of this activity exist is the key. Mix admin time in with billable work and suddenly your utilization stats are awesome (until you glance at your bank account).
Break out the buckets. Log admin as admin. Look at your nonbillables when they exceed 15%. Don’t just work harder, check your process. There’s also another layer, which spreadsheets typically don’t account for: realization. You might log an hour, but that doesn’t necessarily mean you’ll be paid for it. Projects scope out of control, clients negotiate with you and you approve write-downs in order to keep your relationship with them. This can be accounted for with the realization rate adjustment feature in the tool. It is a small thing, but it matters.
If you have a high-volume practice, a ninety-six percent realization rate can wipe out profit margin from a smaller project billed in full. You’re not just selling time. You’re selling the certainty of being paid. This also speaks to role profiles. It’s one thing if you are a solo freelancer versus a big implementation team. Because the solo person has to wear all the hats (sales, accounting, etc.) their nonbillable time will increases. You may need to provide redundant coverage on a team in order to honor service level agreements, resulting in potentially lower use per individual at a managed services team. This is an apples-to-oranges comparison.
Compare yourself to the right benchmark. The healthy range depends on the role context. Then there’s seasonality. The quiet periods vs. Crazy periods can be huge for tax pros. If you don’t account for that when you’re thinking about how many hours per year you want to work, then you’ll either burn out during the busy times of year or you’ll underperform during the slow times. That monthly/quarterly breakdown helps to smooth things out so that you can plan ahead (i.e. Hire someone, subcontract a job) before it’s too late.
Bottom line: Billable hours are ultimately a constraint, not a metric. After considering both business overhead and life overhead, there’s only so much time you’ve got available. That’s why this isn’t about eliminating nonbillable work. (That’s impossible.) It’s about consciously managing it. Only when you have a clear picture of how many hours remain for working on clients can you plan clearly and price confidently. Guessing stops here. Modeling starts now. A great month isn’t often defined by how many hours you put in, it’s defined by how many of your hours actualy counted.