Type I Error Rate Calculator
Estimate the chance of at least one false positive across multiple independent tests, compare Bonferroni and Sidak thresholds, plan sequential looks, and keep Type I error separate from Type II error and power.
🎯Type I Error & Multiple Testing Presets
📝False-Positive Risk Inputs
Sets a realistic starting family size; you can edit every number.
Bonferroni and Sidak convert a family target into a per-test alpha.
Common single-test choice: 5%, written alpha = 0.05.
Count tests in the same family before reading results.
Used for Bonferroni and Sidak thresholds.
Repeated looks inflate false-positive risk unless alpha is spent.
Sequential results here assume independent looks; formal trials need a prespecified monitoring rule.
100% shows the required all-true-null false-positive expectation.
Optional interpretation aid; it does not calculate Type II error.
🔢Current Error-Rate Snapshot
⚙Formula Breakdown
📐Correction Method Reference
| Method | Per-Test Formula | Controls | Best When | Watch Point |
|---|---|---|---|---|
| Unadjusted alpha | entered alpha | Single-test Type I error | One planned test or exploratory scan | FWER rises quickly with m |
| Bonferroni | target / m | FWER at or below target | Any dependence structure | Often conservative for many tests |
| Sidak | 1 – (1 – target)1/m | FWER at target if independent | Independent planned comparisons | Assumes independent tests |
| Same sequential alpha | alpha at each look | No spending control | Explaining inflation from peeking | Raises false positives |
| Bonferroni looks | alpha / k | Per-test ever-error by bound | Simple interim-look planning | Conservative boundaries |
| Sidak looks | 1 – (1 – alpha)1/k | Per-test ever-error if independent | Independent look approximation | Not a full group-sequential design |
🔍Unadjusted 5% Alpha Lookup
| Tests (m) | Per-Test Alpha | Independent FWER | Expected False Positives | Plain Meaning |
|---|---|---|---|---|
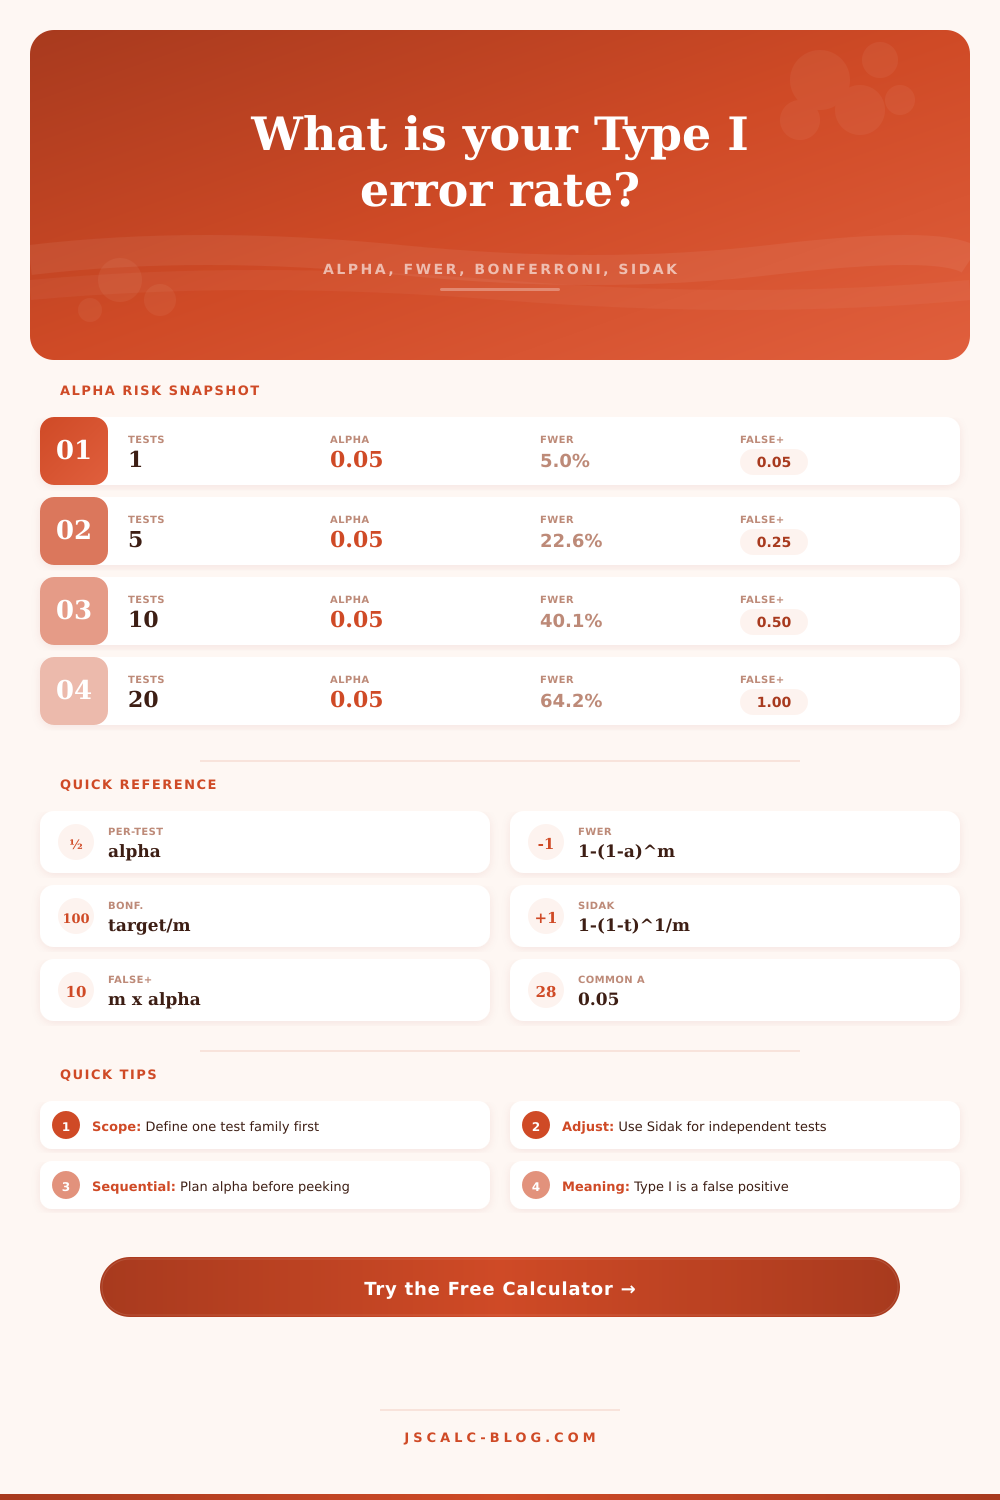
| 1 | 0.05 | 5.0% | 0.05 | Single-test false-positive risk |
| 2 | 0.05 | 9.8% | 0.10 | About 1 in 10 families |
| 5 | 0.05 | 22.6% | 0.25 | False positive becomes common |
| 10 | 0.05 | 40.1% | 0.50 | Nearly 2 in 5 families |
| 20 | 0.05 | 64.2% | 1.00 | About one expected false hit |
| 50 | 0.05 | 92.3% | 2.50 | At least one is very likely |
| 100 | 0.05 | 99.4% | 5.00 | Many false positives expected |
⏱Sequential Look Reference at 5% Per-Test Alpha
| Looks (k) | Same 0.05 Each Look | Bonferroni Look Alpha | Sidak Look Alpha | Planning Note |
|---|---|---|---|---|
| 1 | 5.0% | 0.0500 | 0.0500 | No interim inflation |
| 2 | 9.8% | 0.0250 | 0.0253 | One interim plus final |
| 3 | 14.3% | 0.0167 | 0.0170 | Use a prespecified plan |
| 4 | 18.5% | 0.0125 | 0.0127 | Repeated peeking matters |
| 5 | 22.6% | 0.0100 | 0.0102 | Simple approximation only |
| 10 | 40.1% | 0.0050 | 0.0051 | Formal monitoring preferred |
🧪Scenario Comparison Grid
| Scenario | Tests | Nominal Alpha | FWER if Unadjusted | Bonferroni Alpha | Sidak Alpha | Expected False Positives |
|---|---|---|---|---|---|---|
| Single primary endpoint | 1 | 0.05 | 5.0% | 0.0500 | 0.0500 | 0.05 |
| Education study outcomes | 8 | 0.05 | 33.7% | 0.0063 | 0.0064 | 0.40 |
| Clinical safety labs | 12 | 0.05 | 46.0% | 0.0042 | 0.0043 | 0.60 |
| A/B test variant checks | 24 | 0.05 | 70.8% | 0.0021 | 0.0021 | 1.20 |
| Manufacturing sensors | 50 | 0.05 | 92.3% | 0.0010 | 0.0010 | 2.50 |
| Brain imaging regions | 60 | 0.05 | 95.4% | 0.0008 | 0.0009 | 3.00 |
| Exploratory biomarkers | 200 | 0.05 | 100.0% | 0.0003 | 0.0003 | 10.00 |
| Genome marker pilot | 1000 | 0.05 | 100.0% | 0.0001 | 0.0001 | 50.00 |
💡Actionable Type I Error Tips
Somewhere along the line you’ll run some sort of analysis and get a significant result supporting your hypothesis, everything’s looking perfect with your data. It’s a breakthrough. And then you recall that you ran it through twenty other variables first, none of which worked out. You’re suddenly no longer excited because now you suspect you’ve fallen into the multiple testing trap.
This calculator does the math for you after you input how many tests was in your test family. Saving you from having to guess if that one shiny result was actualy important or simply statistical noise.
Why You Need This Calculator
This is where most researchers gets tripped up. They know about type I error (the probability of rejecting the null when it’s actually correct). That’s called a false positive. That means if you perform a test and your alpha is 0.05, then you’re willing to accept a five percent chance of declaring something as discovered when in fact nothing are there. That’s fine. Most folks can grasp that with just one test.
The issue arise when we perform five tests. Or ten. Or one thousand. At that point the risk doesn’t remain at five percent. Instead, it multiplies. At 0.05 alpha, if you perform 20 unconnected tests, the probability of having at least one false positive climbs past sixty-four percent.
This is why this piece comes so late for most researcher: someone questions their publication. To help visualize this inflation, the tool also allows you to change size of your family (i.e., how many hypotheses). Before viewing the results, however, you must first establish what you mean by “family.” Do you have one main endpoint and three secondary endpoints? Or do you have thousands of markers from exploring some part of genome? These situations is treated differently.
When you choose the Bonferroni correction method, the tool calculates the division of your targeted family-wise error rate by the number of tests. That maintains overall risk while making each individual threshold quite strict. You’d need a lot more evidence to call something significant. It is conservative, but that is why it works.
The Sidak adjustment is a little easier on the eyes for independent tests. Because Sidak assumes that the tests has no impact on one another, it lets you take a little more alpha per test and stay within the same level of family-wide risk. You’ll see the comparison in the calculator, which will let you pick whichever works better for your setup. Bonferroni is safer because presumably your tests are all related. But if they’re really independent, then Sidak provides a little extra power. It is a small exchange, sure, but it is important when you need to find a small effect in noisy data without being overwhelmed by false alarms.
Sequential monitoring also makes things harder. Looking repeatedly at the results of a clinical trial amounts to performing several separate test without correcting your alpha. To account for this, the calculator has fields to input number of sequential looks; it’ll display the resulting increase in error rates. At the default 0.05 level with five interim checks, the error probability rise above twenty-two percent. Unless you assign some alpha over each look, you’ve lost control of your false positive rate. This is spelled out concisely in the reference table on the page.
Many analysts commonly confuse Type I error with Type II error. Type I is a false positive. Type II is a false negative (missing a real effect). Lowering Type I error by adjusting for multiple comparisons makes the bar of significance higher, and will therefore increase Type II error. This is a tradeoff. There’s no free lunch in statistics.
What error are you willing to tolerate for your particular study? For drug safety, false positives can be dangerous. At earlier stages of exploration, missing out on what might become a lead could be more costly. This decision isn’t made by the calculator. It quantifies the risk; it doesn’t choose on your behalf. That’s up to you to bring.
Is it worth inflating the p-value slightly if you’re doing an A/B test on button colors for your website? Probably. Is it okay to do that if you just launched a new medication? No way. Use the tool to get the numbers so you can debate the strategy, not the arithmetic.
There are two keys to conducting honest research: 1) Understand the distinction between a test vs. A family of tests; and 2) Admit when you look at the data more than once that the game has changed. So how do we handle it? How do we control for error? The answer: We don’t get rid of it entirely; we just keep it under control.
Without losing all our firepower, there’s no way to reach zero false positives. But by drawing a line in the sand beforehand, by selecting an approach to correcting those mistakes, then defining that test family with well-defined boundaries, we find ourselves in the sweet spot. From here, the math handles itself.
You don’t need to worry anymore about the hidden traps in your data. You simply need to worry about what the data is trying to tell you. And even when the numbers lie (which they will, as numbers always do), at least you’ll know where the limits are.