Streaming Data Usage Calculator
Estimate how many gigabytes your streaming habit consumes per hour and per month by video quality, then compare that projected usage against your monthly data cap to see your remaining allowance, overage risk, and how many days until you hit the limit.
🎯Real Streaming Presets
📺Your Streaming Habit
Sets the data rate used for streaming hours.
Auto-fills from quality; override with a real value.
Average daily video or audio hours per user.
Billing-cycle days you actually stream, up to 31.
Simultaneous or separate viewers sharing the plan.
Browsing, updates, social, and background traffic.
Plan allowance before throttling or overage fees.
Controls rounding on every result card.
🔢Formula Snapshot
📋GB Per Hour By Video Quality
| Quality | Typical Bitrate | GB Per Hour | GB Per 2 Hr Movie |
|---|---|---|---|
| Audio only music | 0.3 Mbps | 0.14 GB | 0.27 GB |
| Data saver video | 0.7 Mbps | 0.32 GB | 0.63 GB |
| SD 480p | 1.5 Mbps | 0.68 GB | 1.35 GB |
| HD 720p | 3 Mbps | 1.35 GB | 2.7 GB |
| HD 1080p | 6.5 Mbps | 2.93 GB | 5.85 GB |
| 2K 1440p | 10 Mbps | 4.5 GB | 9 GB |
| 4K UHD | 16 Mbps | 7.2 GB | 14.4 GB |
| 4K HDR high | 25 Mbps | 11.25 GB | 22.5 GB |
📱Activity Data Use Per Hour
| Activity | GB Per Hour | GB Per 30 Min | Notes |
|---|---|---|---|
| Music streaming high | 0.14 GB | 0.07 GB | 320 kbps audio |
| Podcast audio | 0.06 GB | 0.03 GB | 128 kbps spoken |
| Social video scroll | 1.5 GB | 0.75 GB | Autoplay HD clips |
| Video call standard | 0.9 GB | 0.45 GB | One-on-one SD/HD |
| Group video meeting | 1.8 GB | 0.9 GB | Multi-party HD grid |
| SD video streaming | 0.7 GB | 0.35 GB | 480p movies or shows |
| HD 1080p streaming | 3 GB | 1.5 GB | Standard modern HD |
| 4K video streaming | 7 GB | 3.5 GB | Ultra HD content |
| Cloud gaming 1080p | 5.4 GB | 2.7 GB | 12 Mbps game stream |
📊Data Cap Examples And Hours Allowed
| Monthly Cap | Hours SD 0.7 | Hours HD 3 | Hours 4K 7 | Music Hours 0.14 |
|---|---|---|---|---|
| 2 GB | 2.9 hr | 0.7 hr | 0.3 hr | 14 hr |
| 10 GB | 14 hr | 3.3 hr | 1.4 hr | 71 hr |
| 25 GB | 36 hr | 8.3 hr | 3.6 hr | 179 hr |
| 50 GB | 71 hr | 17 hr | 7.1 hr | 357 hr |
| 100 GB | 143 hr | 33 hr | 14 hr | 714 hr |
| 250 GB | 357 hr | 83 hr | 36 hr | 1786 hr |
| 500 GB | 714 hr | 167 hr | 71 hr | 3571 hr |
| 1000 GB | 1429 hr | 333 hr | 143 hr | 7143 hr |
🗃Service Quality Comparison Grid
| Service | SD GB/hr | HD GB/hr | 4K GB/hr | Data Saver | Notes |
|---|---|---|---|---|---|
| Video platform A | 0.7 | 3.0 | 7.0 | 0.3 GB/hr | Auto adjusts to speed |
| Video platform B | 0.6 | 1.5 | 7.2 | 0.25 GB/hr | Per-profile quality caps |
| Video platform C | 0.8 | 2.0 | 6.5 | 0.4 GB/hr | 4K on premium tiers |
| Live TV service | 0.9 | 3.5 | 9.0 | 0.5 GB/hr | Higher for live sports |
| Music streaming | 0.04 | 0.14 | 0.29 | 0.02 GB/hr | Lossless raises usage |
| Short video app | 1.0 | 1.5 | 2.5 | 0.6 GB/hr | Autoplay drives volume |
| Cloud gaming | 2.7 | 5.4 | 10.8 | 1.5 GB/hr | Bitrate scales with tier |
| Video conferencing | 0.5 | 1.2 | 2.4 | 0.3 GB/hr | Grid view uses more |
⚙Formula Breakdown
💡Data Saving Tips
Living rooms have become places to stream. Meanwhile, the data-heavy way we consume video on our phones has turned mobile plans into source of data consumption. It’s on-demand entertainment, but there’s a secret price: gigabytes.
Most people guess their usage by remembering how many movies they watched lately, which is about as accurate than estimating household electricity by counting the light switches flipped. Data for streaming flow invisibly at a constant pace; unless you know how fast it runs, you may be caught off guard, facing slower speeds or surcharges. Knowing how it moves let you manage both your bandwidth and spending.
How to Calculate Your Streaming Data Use
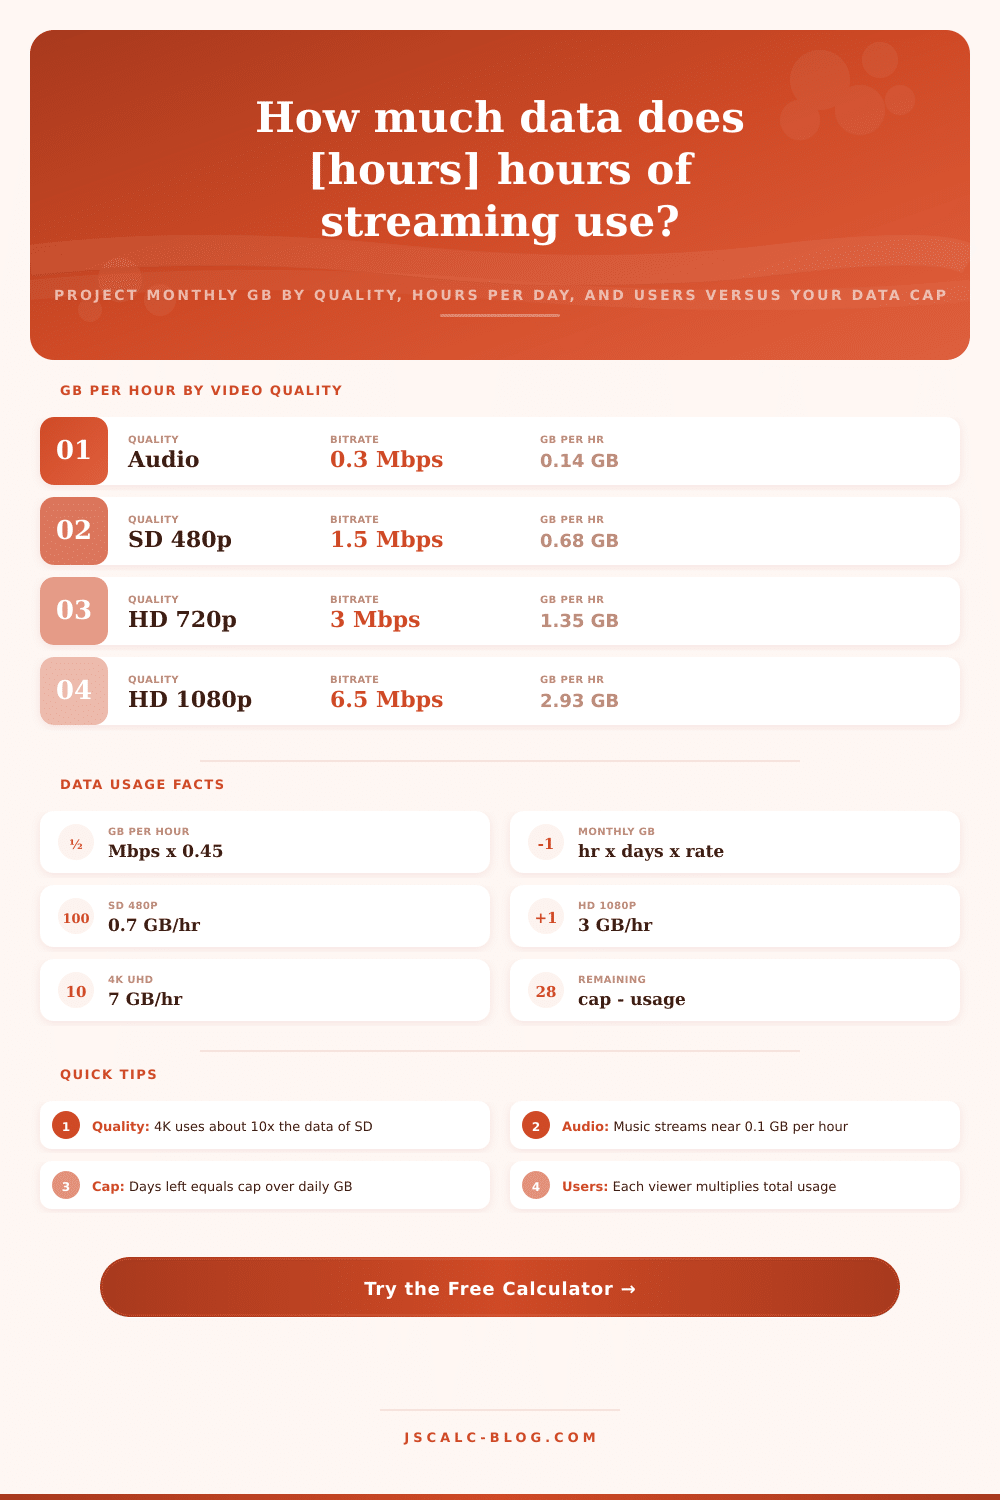
Simple physics applied to digital pipes underpins the mechanism. The bitrates of video streams is expressed in megabits per second. Time is the volume, and width of hose is the number itself. Multiply megabits by seconds in an hour. Divide by eight to convert from bits to bytes, and then divide by a thousand again. This gets you the gigabyte rate. It’s boring math that boils down to this: Gigabytes per hour are about 0.45 times the Mbps rating.
A typical high-definition stream at 6.5 megabits use nearly three gigabytes per hour. This is why choosing resolution can feel so costly. Resolution is the main way to control use. An hour of standard definition video consumes approximately 0.7 gigabytes; an hour of ultra-high-definition 4K jump to around seven gigabytes. For the same episode, that’s a ten-fold variation.
Audio streams much more slowly. Music clocks in at around 0.14 gigabytes per hour, and podcasts consume even less. And when you start to combine types of media, average swings wildly. If you listen to five hours of audio and watch just two hours of 4K video, you’re consuming a lot less data then if you stream everything in top quality.
The calculator the tool offers does all this math for you so you can figure out what happens as you adjust your quality down or swap out video for audio (or vice versa). With hourly rates in place, we can figure out how you actualy use your service. Hours watched times viewers equals daily use. Two hours per viewer watching HD equate to 18 gigabytes per day versus six if everyone just watches one hour. Times that by thirty days and then multiply by some buffer for things like software patches or social media updates, and it add up fast.
The problem with most estimates is that they don’t take into account the multiplier of having more than one device. With family plans, multiple user stream at the same time, which increases the overall total. Now take that estimate and compare it with your monthly cap. Are you on track? Does your habit predict 200 gigabytes when you’ve only got 100 per month left in your allowance?
This is where the calculator gets really interesting: It’ll show you exactly how many more days you have at this pace. It takes an abstraction, “Oh I’m just kind of worried about going over”… And makes it concrete. You can see if you’re coasting along at 40 percent usage or if you’re approaching 90 percent. Before you get slapped with those pesky overage fees, you’ll know it’s time to decide.
To connect theory and practice, presets can loads some common patterns such as light/standard-def casual use, or heavier 4K use. There’s no need to remember which services require what bitrate. Select the pattern closest to your household, fine-tune the days per month if necessary then leave it to the tool to crunch the numbers. Contextual reference tables on the page show you just how many hours of different quality levels will fit within typical caps, from 2 gigs up to a terabyte. That grounds the numbers back into something experiential.
But you need to give it truthful answers to get good results. Enter the real data rate for your true service. Not some arbitrary mean, and count every device that streams on the plan. Those little tweaks adds up fast. Reducing just one quality level (or moving background TV to radio) will free up hundreds of gigs during the billing period.
Once dialed-in with these numbers, you won’t be guessing anymore; you’ll know if your streaming habit is compatible with your plan. It is not so much about depriving yourself as it is about knowing how many gigabytes your pipe supports. You should of known earlier!