Concurrent User Bandwidth Calculator
Size the internet or WAN link for an office, campus, hotel, or venue full of people. Enter your total user count, the share active at peak, and a per-user profile, then apply a contention ratio and headroom reserve to get peak aggregate bandwidth, a recommended provisioned link, per-user allotment, and how many users a given link can carry.
🎯Real Deployment Presets
📝Bandwidth Inputs
Everyone who could connect, active or idle.
Share generating traffic in the busy hour.
Sets typical demand per active user.
Editable; profile presets fill this in.
1:1 provisions full peak; 4:1 shares a link.
Spare capacity above peak for growth and bursts.
Portion flowing upstream; calls are near 50.
Used to test users supportable per link.
🔢Formula Snapshot
📊Per-User Bandwidth Profiles
| Usage Profile | Typical Activity | Per User (Mbps) | Upload Weight |
|---|---|---|---|
| Light browsing | Email, web, chat | 1 to 2 | Low |
| Office and VoIP | SaaS, docs, calls | 3 to 5 | Medium |
| Video conferencing | Zoom, Teams HD | 3 to 8 | High |
| Cloud + HD stream | VDI, 1080p video | 8 to 12 | Medium |
| Heavy media | 4K video, large files | 25 | Medium |
| Guest Wi-Fi | Mixed casual use | 2 to 4 | Low |
🏢Concurrency Assumptions by Venue
| Venue Type | Devices per Person | Peak Concurrency | Notes |
|---|---|---|---|
| Corporate office | 1.0 to 1.5 | 60 to 80 percent | Steady workday load |
| School / campus | 1.0 to 2.0 | 50 to 70 percent | Bursts between classes |
| Hotel guest Wi-Fi | 2.0 to 3.0 | 25 to 40 percent | Evening streaming peak |
| Coworking space | 1.5 to 2.5 | 60 to 75 percent | Mixed pro workloads |
| Conference hall | 1.5 to 2.5 | 40 to 60 percent | Session-driven spikes |
| Stadium / arena | 1.0 to 1.5 | 30 to 50 percent | Social and highlight bursts |
⚖Contention Ratio Guidance
| Ratio (N:1) | Best For | Experience | Risk Level |
|---|---|---|---|
| 1:1 | VoIP, video, SLAs | Full peak guaranteed | Lowest |
| 2:1 | Business apps | Rare slowdowns | Low |
| 4:1 | General browsing | Good most hours | Moderate |
| 10:1 | Light guest Wi-Fi | Occasional lag | Higher |
| 20:1 | Casual public use | Slow at peak | High |
| 50:1 | Very light hotspots | Best-effort only | Highest |
🗃Deployment Comparison Grid
| Scenario | Users | Concurrency | Per-User Mbps | Peak Mbps | Link Needed |
|---|---|---|---|---|---|
| Small office | 25 | 75% | 4 | 75 | 100 Mbps |
| Mid office | 100 | 70% | 4 | 280 | 350 Mbps |
| Call center | 50 | 90% | 4 | 180 | 250 Mbps |
| Video team | 60 | 80% | 6 | 288 | 350 Mbps |
| School | 250 | 60% | 3 | 450 | 600 Mbps |
| Hotel Wi-Fi | 500 | 30% | 3 | 450 | 600 Mbps |
| Coworking | 120 | 70% | 6 | 504 | 650 Mbps |
| Conference | 400 | 50% | 3 | 600 | 750 Mbps |
| Stadium | 1000 | 40% | 1.5 | 600 | 1 Gbps |
| Remote branch | 15 | 80% | 4 | 48 | 100 Mbps |
⚙Formula Breakdown
💡Sizing Tips
Typically, just before a budget meeting, you look at some bewildering spreadsheet, decide what amount of bandwidth you want, and then go into the meeting. Most planners assume that users all suck down data simultaneousy, like so much water from a tank. Not true. Users surf web pages; they check their email; they fall asleep during meetings; they leave their devices on standby for hours at a time. In other words: real traffic is social, not mechanical; it’s spiky, not constant. You don’t buy enough pipe to allow everybody to shout at the same time, since that doesn’t happen. You buy enough pipe to allow enough people to shout at one time to drown out the rest of them. That makes all the difference in how you size your link.
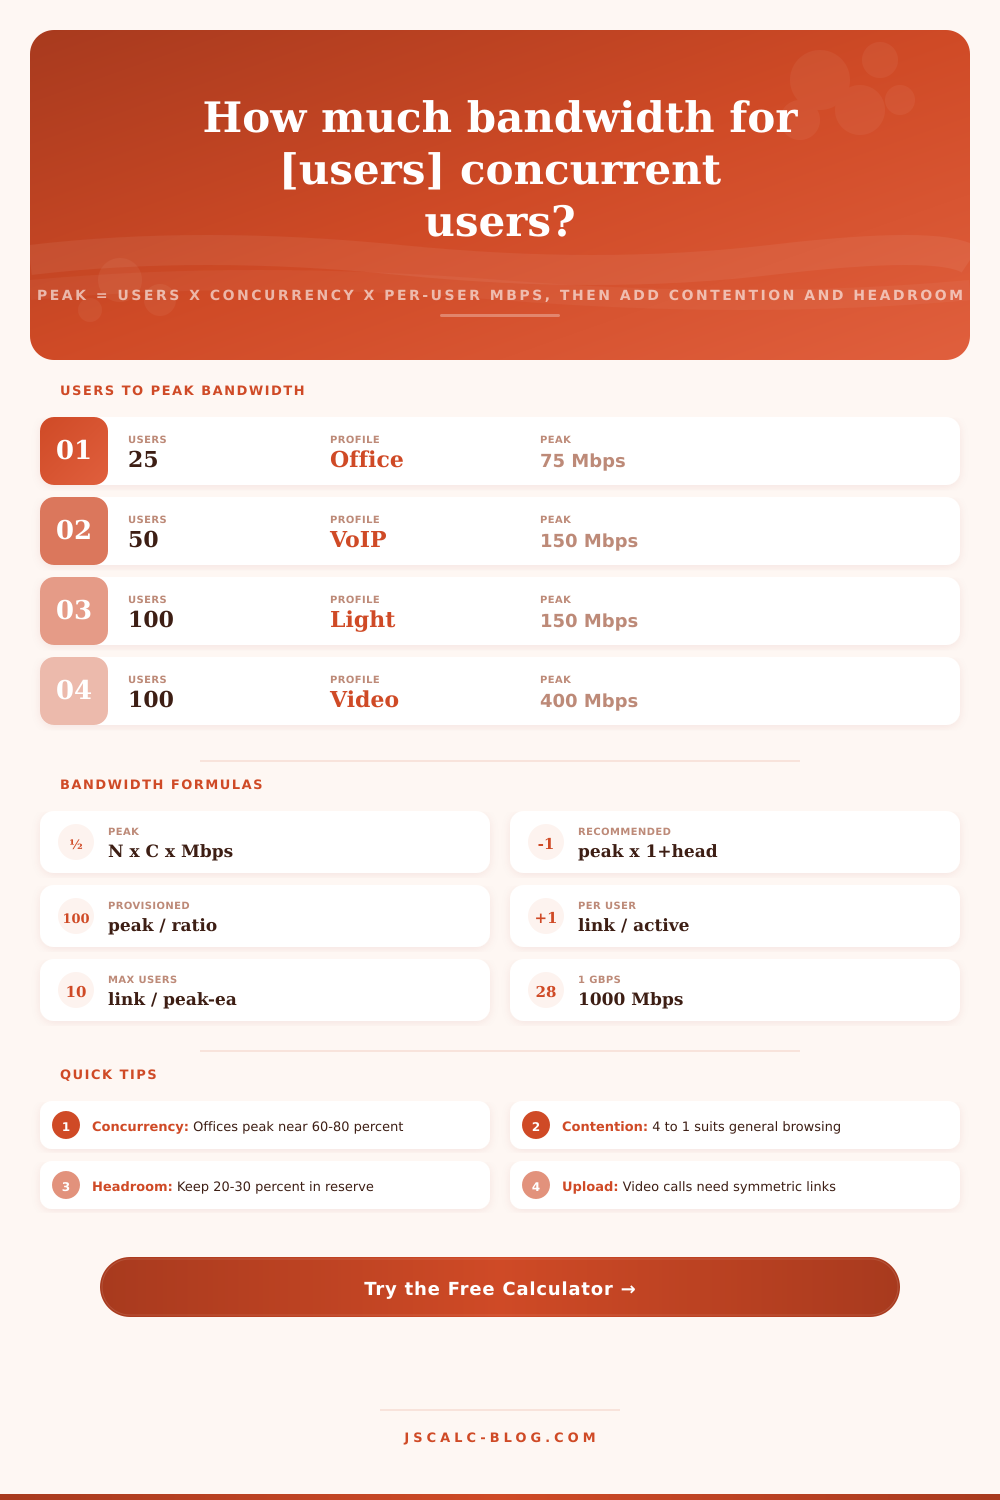
This page has a nifty calculator; it takes care of the mathematics by concentrating on the busy hour… Not the average day. Its starting point is three numbers: (1) total number of users, (2) how many will be using the network at peak time, and (3) each user’s demand level. Multiply these three things together and you’ll discover the actual total load your network experience during its most stressful moment. So, for instance, if seventy of your one-hundred employees are actively using the network during some Tuesday-morning stand-up session, then your baseline is the number seventy multiplied by each person’s personal consumption rate. This avoids the huge over-provisioning problem hurting networks scaled to meet theoretical maximums rather than observed realities.
How to Size Your Network Bandwidth
The catch? You need to understand what “active” actualy means in your own particular cultural/industrial context. This can vary widely from culture to culture and industry to industry. The tricky part is concurrency. Most of these estimates assume that people will be on all day long, which isn’t always true. You can make a fair guess based off what’s happening in your own house or office, but you need an actual eyeball to be accurate (because hopes are not facts). If you’re sitting in a hotel lobby, the concurrency may spike up around 30% even though the building is fully occupied (guests trickle in, turn off their phones as they drift asleep, etc.). Offices are the opposite: Expect anywhere from 60-80% concurrent use during the core workday, often driven by collaborative tools. And schools… well, they cluster into sudden spikes whenever those class bells ring.
The table below, available on the page. Shows you how each venue type plays out and provides some reasonable baselines so you don’t have to stare at an empty form wondering if 40% is a good estimate for a conference room.
With that said, once you know the peak demand, there’s an economic truth: oversubscription. Because each customer spike is smoothed out by big numbers, internet providers don’t often provision the theoretical maximum to all customers. If you have a four to one contention ratio, you’re provisioning just twenty-five percent of the total peak, assuming most people won’t watch high-def video at once. That’s great if your users are emailing and casually surfing, but it sucks when they want to conference on a HD call or make a VoIP phone call because any kind of latency ruins their trust in the network immediately.
The higher the importance of the workload, the lower the ratio needs to be. Expect to guarantee a one-to-one ratio to video teams. Ten-to-one is a safe bet for guest Wi-Fi. No one notices.
Twenty to thirty percent more than you calculate is headroom, the insurance against surprise growth and a bad day. That extra bit of capacity give you breathing room. You can run an all-hands meeting without choking the whole floor and roll out a software update without slowing down everyone’s network. It allows you to feel like the network is fast. Even though it is under load. Use this number as the anchor in your negotiation with vendors and as target in your buying conversations.
Negotiate based on data, not a vendor’s suggestion. Two hundred fifty? Sure, if the sales guy gave me a discount. Frustration awaits you next month if your math was three hundred fifty.
That’s not to say that it’s all about raw numbers; direction is also key. While traditional browsing has a strong server pull component, video calling pushes almost as much data upstream as it gets. If you don’t account for the upload portion of your traffic profile, you could end up purchasing a fiber connection that appears large on paper. Only to choke during critical meetings due to an insufficient return path. For those who do a lot of communication, symmetric connections are the answer; asymmetric lines work for consumer venues with more downloads than uploads. Once you enter in your upload percentage, the tool automatically divides things into directions and shows if your existing plan aligns with how you use the internet.
Try out one of the predefined scenarios, which show how different numbers change given certain contexts, but modify it until it aligns with your own situation. For example, see how doubling your team’s concurrency rate from 50% to 80% doubles your bandwidth needs. This shows why it is important to model user behavior accurately rather than just using raw headcounts.
Run the results through the per-user allotment output. Make sure anyone who goes online has enough connection to do their work without slowing down everyone else’s experience. Remember, sizing a shared network isn’t as much a science of perfect engineering as it is understanding what’s possible within limited resources while helping people manage their expectations. If you can get those three inputs correct, then you’ll be able to know if your internet is too slow or just expensive.