Storage Growth Projection Calculator
Project how much storage you will use in the years ahead with compound, linear, or stepped growth models. Find when a volume crosses your planning threshold, when it hits 100 percent full, and exactly how much capacity to buy today for the headroom you need tomorrow.
🎯Real Growth Scenario Presets
📊Storage and Growth Inputs
How much data lives on the volume today.
Unit for the used field above.
Usable size of the volume or array.
Unit for the capacity field above.
How the used space is expected to grow.
Used by the compound model, percent per year.
Used by linear and stepped models.
Stepped model only, a once a year jump.
How far ahead to project the usage.
Trigger expansion at this fill level, e.g. 80.
Bulk load added up front, in used-storage unit.
Controls rounding on every result card.
🧮Formula Snapshot
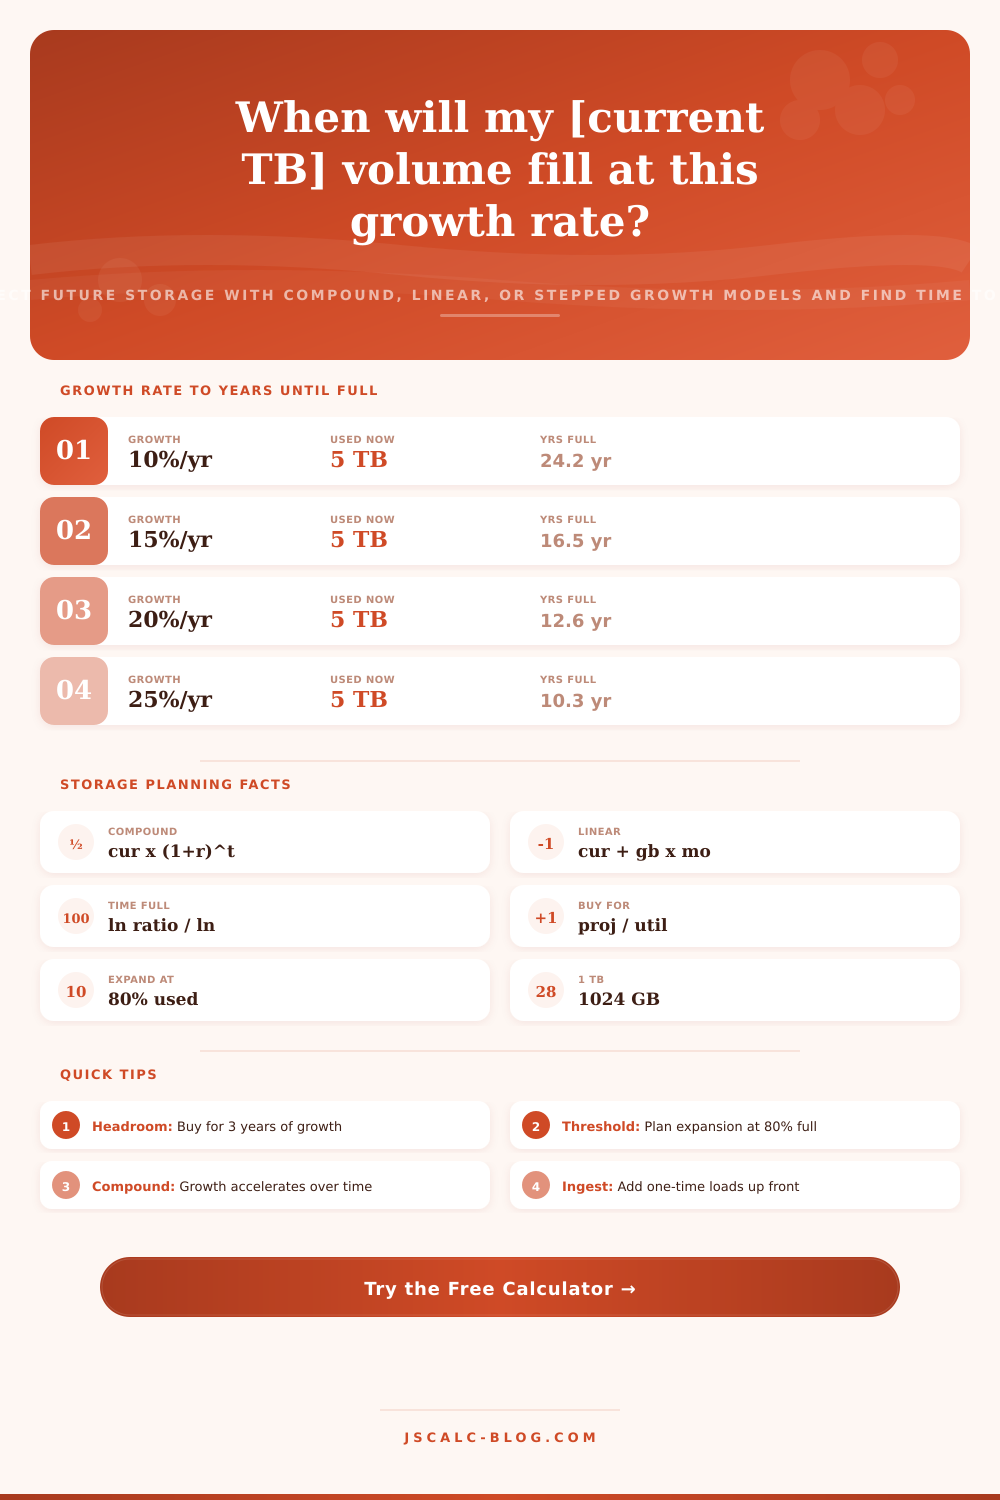
📈Compound Growth: Years Until 100% Full
| Annual Growth | Used Now | Capacity | Years Until Full |
|---|---|---|---|
| 10 %/yr | 5 TB | 20 TB | 14.5 years |
| 15 %/yr | 5 TB | 20 TB | 9.9 years |
| 20 %/yr | 5 TB | 20 TB | 7.6 years |
| 25 %/yr | 5 TB | 20 TB | 6.2 years |
| 30 %/yr | 5 TB | 20 TB | 5.3 years |
| 40 %/yr | 5 TB | 20 TB | 4.1 years |
| 50 %/yr | 5 TB | 20 TB | 3.4 years |
| 75 %/yr | 5 TB | 20 TB | 2.5 years |
📋Linear Growth: Months Until Full
| Monthly Growth | Used Now | Free Space | Months Until Full |
|---|---|---|---|
| 50 GB/mo | 5 TB | 15 TB | 307 months |
| 100 GB/mo | 5 TB | 15 TB | 154 months |
| 200 GB/mo | 5 TB | 15 TB | 77 months |
| 350 GB/mo | 5 TB | 15 TB | 44 months |
| 500 GB/mo | 5 TB | 15 TB | 31 months |
| 750 GB/mo | 5 TB | 15 TB | 20 months |
| 1000 GB/mo | 5 TB | 15 TB | 15 months |
| 2000 GB/mo | 5 TB | 15 TB | 8 months |
🗃Year-by-Year Projection Comparison Grid
| Year | 10%/yr Used | 10% Full | 25%/yr Used | 25% Full | 40%/yr Used | 40% Full |
|---|---|---|---|---|---|---|
| Now | 5.00 TB | 25% | 5.00 TB | 25% | 5.00 TB | 25% |
| Year 1 | 5.50 TB | 28% | 6.25 TB | 31% | 7.00 TB | 35% |
| Year 2 | 6.05 TB | 30% | 7.81 TB | 39% | 9.80 TB | 49% |
| Year 3 | 6.66 TB | 33% | 9.77 TB | 49% | 13.72 TB | 69% |
| Year 4 | 7.32 TB | 37% | 12.21 TB | 61% | 19.21 TB | 96% |
| Year 5 | 8.05 TB | 40% | 15.26 TB | 76% | 26.89 TB | 134% |
| Year 6 | 8.86 TB | 44% | 19.07 TB | 95% | 37.65 TB | 188% |
| Year 7 | 9.74 TB | 49% | 23.84 TB | 119% | 52.71 TB | 264% |
| Year 8 | 10.72 TB | 54% | 29.80 TB | 149% | 73.79 TB | 369% |
📏Storage Unit Reference
| Unit | Equals | In Gigabytes | Typical Use |
|---|---|---|---|
| 1 GB | 1024 MB | 1 GB | A single video file |
| 1 TB | 1024 GB | 1024 GB | Desktop drive size |
| 1 PB | 1024 TB | 1048576 GB | Enterprise data lake |
| 10 TB | 10240 GB | 10240 GB | Small NAS array |
| 100 TB | 0.098 PB | 102400 GB | Media production |
| 1 EB | 1024 PB | Very large | Hyperscale cloud |
⚙Formula Breakdown
💡Capacity Planning Tips
For the infrastructure owner, this storage growth projection calculator is answering a very clear question. How many months before you run out of storage? How much storage do I have to buy again? Data continues to build and what’s comfortabley at twenty-five percent full might be an emergency two years from now. Looking ahead with three realistic growth models, this tool identifies the month a given volume breaks your planning threshold. It predicts when it reaches one-hundred percent full. And it suggests how much to purchase to hit a healthy fill level instead of a cliff edge.
It’s both stressful and expensive when your disk gets near-full and then you react. Migrations are rushed, and drives is ordered at emergency pricing with no discount. That new volume runs hot as it barely makes it through its last few stages before performance suffer.
How to Plan Your Storage Growth
With projection, you flip the timeline: instead of wondering what will happen next month, you know, you’ve mapped out your used space increase month-over-month. You can plan for an expansion months out, within a maintenance window. And you can negotiate pricing and take the time to stage the migration calmly. Knowing the growth curve early, and seeing that growth turn from vague anxiety into a concrete purchase order date, does almost everything to turn panicked capacity management into planned capacity management.
The calculator’s three shapes reflect real-world differences in how storage grows. The compound model assumes it grow at a certain percent each year. This is appropriate for things that scale with themselves. Examples include backup repositories or user file shares that grow because there are more files, which leads to more changes. Linear assumes you get a set amount of monthly bytes added. That’s good if you’re feeding predictable stuff into it (e.g., a surveillance system spitting out a constant flow of video). Stepped assumes you’ll have a regular amount of data growing each month, but then gets a one-time jump every year. That works well for when you do an annual mass loading like adding new sources, or when you routinely add lots of bulk data like a research archive.
You don’t need to enter super accurate numbers. What matters is picking the right shape: pick wrong and you plan poorly.
The future size equals current used times (1 + annual rate) to the power of the number of years. That’s 1.20 to the fifth power. Five years later: about 12.44 terabytes. Want it month by month? Use this formula to convert the annual rate into a monthly one: one plus the rate, raised to the one-twelfth power, minus one. This month: roughly 1.53 percent. Future size = Current Used + (monthly gain) x (number of months). For linear growth, the math couldn’t be easier. But compound acceleration catches people by surprise which makes the implications much heavier.
Often the best result isn’t a number but a date: when will this thing grow to reach my threshold or match my capacity? That’s what the calculator does; it calculates the time t that answers the growth equation for you. It says t = ln(target / current) ÷ ln(1 + rate). If you have 5 terabytes and want to know how long it’ll take till you hit 16 terabytes growing at twenty percent a year, it says ln(16/5) ÷ ln(1.2), which is roughly 6.4 years. With linear growth, you just find the difference between your targets in months and subtract the number of months that have already passed.
The tool returns two dates: first the months-until-your-planning-threshold, then the months-until-the-volume-is-completely-exhausted. Both the impending hard deadline and the early warning is visible.
Know the size: “You don’t want to do a new volume at full capacity.” Don’t just know how much to order in five years (44 terabytes), but how you want it ordered. Your recommended purchase is the horizon projection divided by your desired utilization. 15.You have 55 usable terabytes. This leaves room for intentional overhead. You can use this space for reorg space to keep SSD pools and file systems fast, for temporary spikes, or for snapshots. 55 usable terabytes. Leaves room for intentional overhead: Reorg space required to keep SSD pools and file systems fast, temporary spikes, snapshots, whatever you need.
Scale up or down the threshold; scale up or down the horizon. Weigh longer runway vs larger initial purchase. Storage’s cheaper to add now than scramble to buy later. A three-year headroom is a conservative bet.
And then there are presets, fully fleshed-out, lifelike scenarios you can play with right out of the box. The home NAS grows at twenty percent a year. The smb file server rising thirty-five percent. The video studio adds 500 gigabytes a month. All of which fill the form and show how drastically different the growth model makes all the difference. Compound scenarios will speed up. What might seem harmless now can double your usage within a few years. Linear scenarios will simply march along at their steady pace, easy to plan against but relentless. And seeing them side by side helps build intuition about what your own numbers might mean.
It shows four result cards that sum up the projection. This is the projected size at your horizon with its percent full. This is the time till the threshold. This is the time till one hundred percent. This is the recommended capacity to buy. There’s also a breakdown panel below where it lists all the substituted values so you can audit the arithmetic. And there are reference tables showing months until full across linear rates, and years until full across compound rates.
Related calculators for backup sizing, overhead and capacity are available on JSCalc-Blog.com in a deeper library of planning tools. Get started with a preset here. Plug in your current capacity and used space. Choose the model that fits your data. Turn the handle and watch the projection change a vague worry over running out into a concrete size and date to make a purchase.