Server Sizing Calculator
Translate a real workload into infrastructure. Enter concurrent users, requests per user, average CPU time per request and memory per session, and this planner returns the required vCPUs, total RAM, and the number of servers you need after applying a target utilization headroom and an N, N+1 or N+2 redundancy model.
🎯Real Deployment Presets
🖥Workload Inputs
Active sessions hitting the app at the same time.
Typical active user is 0.1 to 0.5 req/s.
CPU-seconds burned per request, in milliseconds.
Memory each concurrent session holds.
OS, runtime and app working set per fleet.
Cores available on each node or instance.
Usable memory on each node or instance.
Peak headroom ceiling; 60 to 75 is common.
Peak load over average, often 2 to 3x.
Extra nodes so failures do not drop capacity.
🔢Sizing Formula Snapshot
📋Workload Sizing Rules of Thumb
| Workload Type | CPU Time / Request | RAM / Session | Request Rate |
|---|---|---|---|
| Static site / CDN origin | 2 - 10 ms | 1 - 4 MB | 0.2 - 1.0 req/s |
| Dynamic web app | 50 - 150 ms | 8 - 20 MB | 0.2 - 0.5 req/s |
| REST / JSON API | 10 - 60 ms | 2 - 8 MB | 1 - 10 req/s |
| OLTP database | 5 - 40 ms | 20 - 80 MB | 0.5 - 3 req/s |
| VDI virtual desktop | 150 - 400 ms | 2000 - 4000 MB | 0.1 - 0.3 req/s |
| Reporting / analytics | 300 - 2000 ms | 50 - 250 MB | 0.05 - 0.2 req/s |
| File / print server | 3 - 15 ms | 4 - 12 MB | 0.1 - 0.4 req/s |
📊Instance and Server Tiers
| Tier | vCPU | RAM (GB) | Example Class | Best Fit |
|---|---|---|---|---|
| Micro | 2 | 4 | t3.medium | Dev, low traffic |
| Small | 4 | 16 | m6i.xlarge | Small web app |
| Standard | 8 | 32 | m6i.2xlarge | General workloads |
| Large | 16 | 64 | m6i.4xlarge | Busy API, DB |
| Compute | 32 | 64 | c6i.8xlarge | CPU-bound apps |
| Memory | 16 | 128 | r6i.4xlarge | Cache, in-memory DB |
| XLarge | 64 | 256 | m6i.16xlarge | VDI, big clusters |
🛡Redundancy Models Compared
| Model | Spare Nodes | Survives | Overhead | Typical Use |
|---|---|---|---|---|
| N | 0 | No failure | 0 pct | Dev / staging |
| N+1 | 1 | 1 node down | Varies | Production standard |
| N+2 | 2 | 2 nodes down | Higher | HA, patching window |
| 2N | N | Full site loss | 100 pct | Active-active DR |
🗃Workload to Server Sizing Comparison Grid
| Deployment | Users | Peak RPS | Req vCPU | Req RAM | Nodes (N+1) |
|---|---|---|---|---|---|
| 500-User Web App | 500 | 300 | ~35 | ~12 GB | 5 + 1 |
| 1k-User Web App | 1000 | 600 | ~69 | ~18 GB | 9 + 1 |
| 10k RPS API | 2000 | 10000 | ~430 | ~24 GB | 27 + 1 |
| VDI 200 Desktops | 200 | 120 | ~103 | ~406 GB | 13 + 1 |
| Small File Server | 50 | 20 | ~1 | ~4.6 GB | 1 + 1 |
| 2k E-Commerce | 2000 | 1600 | ~183 | ~54 GB | 12 + 1 |
| OLTP Database | 800 | 640 | ~37 | ~146 GB | 5 + 1 |
| Microservices | 1500 | 3000 | ~129 | ~30 GB | 9 + 1 |
| Redis Cache Tier | 3000 | 9000 | ~39 | ~184 GB | 6 + 1 |
| Video Edge Node | 4000 | 2000 | ~57 | ~70 GB | 8 + 1 |
⚙Formula Breakdown
💡Capacity Planning Tips
The Server Sizing Calculator will tell you how much hardware you need for a given workload. Unlike past methods (copying last year’s fleet or guessing at instance types), you explain it in plain terms. How many concurrent user? How frequently do they send requests? How much memory does a session consume? How long does a request use the CPU?
The calculator translates that to the number of servers needed, their total RAM, and their required vCPUs. It then adds some utilization headroom. Because nobody want anything running at max capacity. And it adds some redundancy; because one failure shouldn’t cut into your available capacity.
How to Use the Server Sizing Calculator
The key metric is request rate. How many requests do you expect a server to handle per second? Does it matter how many concurrent login there are? No. The server doesn’t give a damn about logins. It cares about request rates.
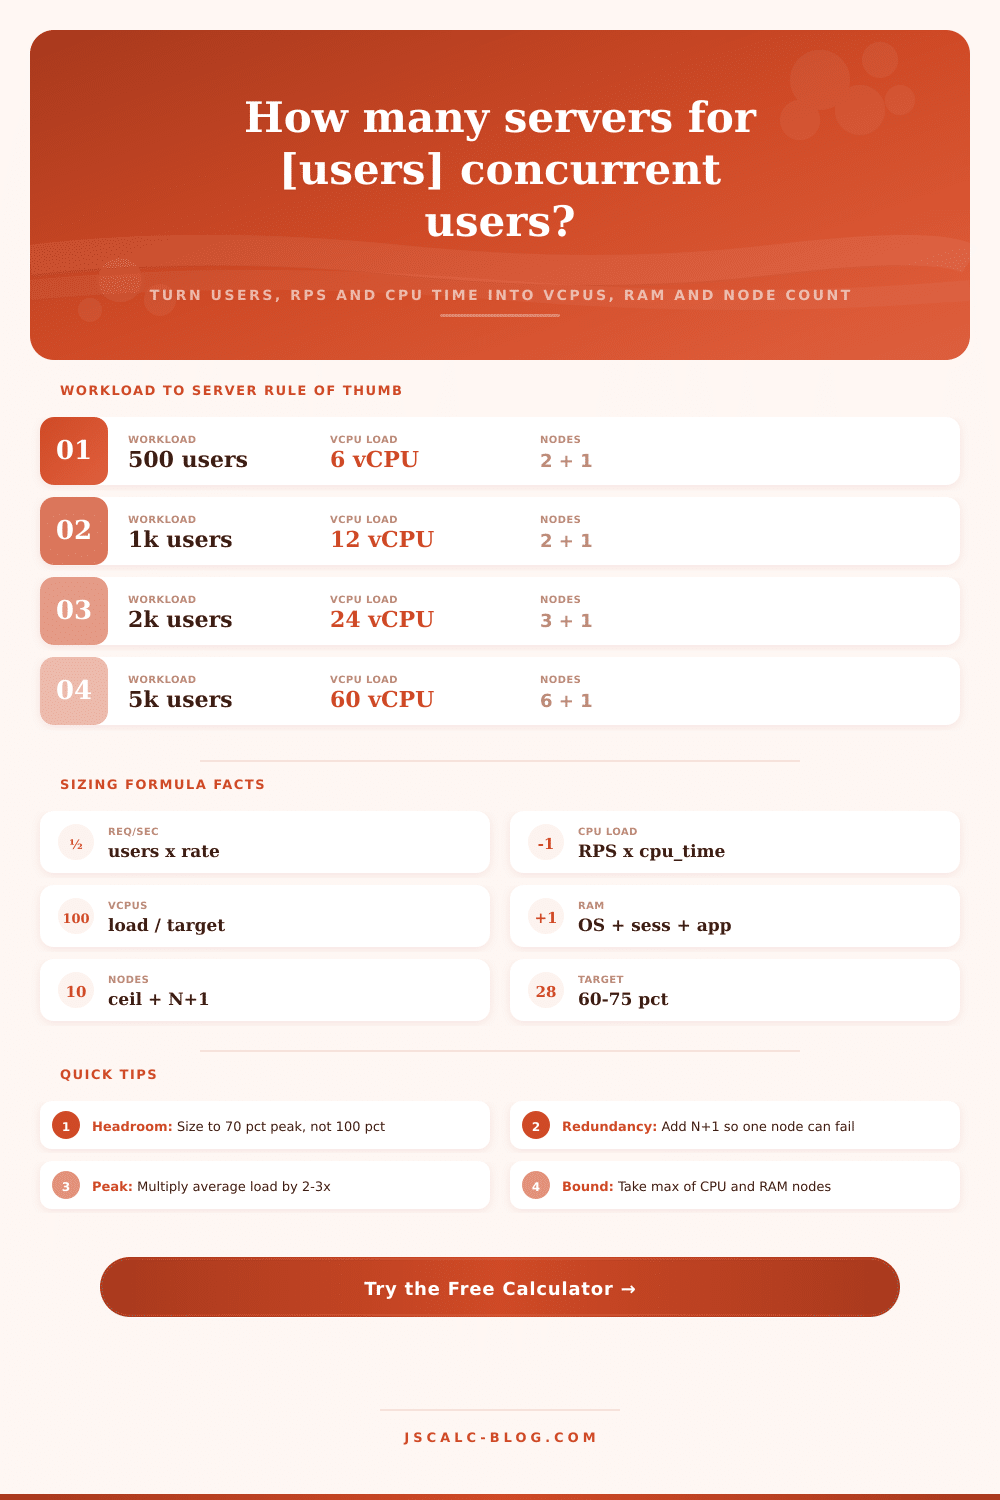
Here’s the calculation: 500 concurrent users making 0.3 requests/second = ~150 requests/second average traffic. People get this wrong because they think math is simple. Traffic isn’t even. It’s bursty. So size for the peak and not just the daily mean. Use a peak multiplier (typically 2-3x based off avg)
With the highest possible number of requests per second, how many CPUs do you need? How much work does each request require? How much work does each request require (in seconds), assuming it needs 80 milliseconds of CPU? That’s 0.08 seconds of work. Multiply that by peak requests, and you have your raw CPU demand in terms of core.
Don’t ever size for exactly this number. Divide by 70% (your target utilization) to get a higher number of vCPUs that account for traffic spikes, garbage collection pauses, and background jobs. The headroom between these two figures is what separates a fleet that can absorbs load from one that crashes when put under pressure.
But then there’s another equation: memory. It is the base OS footprint plus the amount of memory used per active session. And some workloads don’t consume CPU as much as they do memory. They have large amounts of RAM but minimal CPU usage. If you sized only based off cores, it would fill up swap space and be dead slow.
That’s where the calculator comes into play: You enter in the base overhead and how much memory each session consumes and let it do math for you. It protects you from undersizing the first resource to fill up.
The key to this is counting the number of servers, and that’s where the double-bounded thinking come into play. To get your CPU-bound number of nodes, divide amount of vCPUs you need by the number of cores in each server. Divide the amount of RAM you need by the amount of memory per server for your RAM-bound number. Then, take whichever number is higher. You may require five servers worth of memory but only three servers worth of CPU. Five is the correct result. By taking the largest one, the estimation will never secretly under-provide for the bottleneck.
Active capacity is only half the design. Nodes go offline for maintenance, hardware fails, and we must patch the kernel. To account for this, the calculator includes spares based on your desired redundancy model. N means no spare, good enough for development. N+1 adds a single spare, allowing you to lose a node without reducing capacity. For most teams, that’s the production standard. N+2 adds two spares, giving you survival in case a node goes down while another is down for patching. Active nodes and spares are displayed separately, making the trade-off clear in the result.
A napkin capacity plan is wrong. Always, and always in costly ways. Either it spends budget buying useless hardware or it makes users wait for resources under load. This tool takes all those elements, request rate math, CPU-time demand, memory accounting, dual-bound node counting, redundancy, and utilization headroom, and presents them together to give you a defensible number to start from.
Take its result as your engineering baseline. Run a load test to validate. Monitor actual use. Tune the numbers as traffic scales. Instead of guessing, you’ll size the fleet correctly, turning infrastructure into a predictable utility. We don’t aim only to stay online. We aim to stay responsive when it matters. Actualy, we should of aimed for more.