Data Center Power Usage Effectiveness (PUE) Calculator
Measure data center efficiency with PUE = total facility power divided by IT equipment power. Enter cooling, distribution, and lighting loads or a single total, and get PUE, DCiE percent, non-IT overhead power with a rating band, and annual facility energy in kWh per year.
🔌Choose an Input Method
🏗Real Facility Type Presets
⚡Facility Power Inputs
Servers, storage, and network gear at the PDU output.
Chillers, CRAC/CRAH units, pumps, and fans.
UPS, PDU, and transformer conversion losses.
Lighting, security, and building support loads.
Metered IT load; used to divide the total below.
Whole-facility draw at the utility meter.
Default 8760 h for continuous 24/7 operation.
Optional efficiency metric for annual energy cost.
Controls rounding on the ratio result cards.
🔢Formula Snapshot
📊PUE Rating Bands
| PUE Range | Rating | DCiE | What It Means |
|---|---|---|---|
| 1.0 - 1.2 | Excellent | 83 - 100% | Hyperscale, liquid or free cooling |
| 1.2 - 1.5 | Efficient | 67 - 83% | Modern colo and cloud campus |
| 1.5 - 2.0 | Average | 50 - 67% | Typical enterprise data center |
| 2.0 - 2.5 | Poor | 40 - 50% | Legacy rooms, weak airflow control |
| Above 2.5 | Very poor | Below 40% | Server closets, no containment |
| 1.0 exactly | Ideal limit | 100% | Zero overhead, theoretical only |
🏗Typical PUE by Facility Type
| Facility Type | Typical PUE | Cooling Style | DCiE |
|---|---|---|---|
| Liquid-cooled AI hall | 1.05 - 1.10 | Direct-to-chip | 91 - 95% |
| Hyperscale cloud | 1.10 - 1.20 | Air + economizer | 83 - 91% |
| Nordic free-cooling | 1.10 - 1.20 | Outside air | 83 - 91% |
| Modern colocation | 1.30 - 1.50 | Contained aisles | 67 - 77% |
| Enterprise data center | 1.50 - 1.80 | CRAC units | 56 - 67% |
| Legacy server room | 1.90 - 2.20 | Comfort cooling | 45 - 53% |
| Small server closet | 2.20 - 3.00 | Split A/C | 33 - 45% |
📏DCiE vs PUE Conversion
| PUE | DCiE = 1 / PUE | Overhead per 1 kW IT | Efficiency |
|---|---|---|---|
| 1.0 | 100% | 0.00 kW | Perfect |
| 1.1 | 90.9% | 0.10 kW | Excellent |
| 1.25 | 80.0% | 0.25 kW | Efficient |
| 1.5 | 66.7% | 0.50 kW | Average |
| 1.8 | 55.6% | 0.80 kW | Below average |
| 2.0 | 50.0% | 1.00 kW | Poor |
| 2.5 | 40.0% | 1.50 kW | Very poor |
| 3.0 | 33.3% | 2.00 kW | Wasteful |
🗃Facility Load and Efficiency Comparison Grid
| Facility | IT kW | Cooling kW | Losses kW | Total kW | PUE | DCiE |
|---|---|---|---|---|---|---|
| Liquid-cooled AI | 1000 | 60 | 20 | 1080 | 1.08 | 92.6% |
| Hyperscale | 1000 | 80 | 20 | 1100 | 1.10 | 90.9% |
| Nordic free-cool | 500 | 55 | 20 | 575 | 1.15 | 87.0% |
| Cloud campus | 800 | 160 | 40 | 1000 | 1.25 | 80.0% |
| Modern colo | 500 | 170 | 30 | 700 | 1.40 | 71.4% |
| Enterprise | 200 | 96 | 24 | 320 | 1.60 | 62.5% |
| Edge micro | 50 | 36 | 4 | 90 | 1.80 | 55.6% |
| Legacy room | 100 | 90 | 10 | 200 | 2.00 | 50.0% |
| Server closet | 20 | 28 | 2 | 50 | 2.50 | 40.0% |
🔧Typical Overhead Breakdown
| Overhead Component | Share of Non-IT | PUE Contribution | Reduce By |
|---|---|---|---|
| Cooling & HVAC | 60 - 75% | 0.20 - 0.60 | Free cooling, containment |
| UPS & battery loss | 10 - 15% | 0.05 - 0.15 | Eco-mode UPS |
| PDU & transformer | 5 - 10% | 0.02 - 0.08 | Higher voltage distribution |
| Lighting & other | 3 - 8% | 0.01 - 0.05 | LED, motion sensors |
| Humidity control | 2 - 6% | 0.01 - 0.04 | Wider set-point range |
| Total non-IT | 100% | PUE - 1.0 | Overall efficiency work |
⚙Formula Breakdown
💡Data Center Efficiency Tips
The power bill for a data center shows you a big number for electricity use, but that’s just one number hiding many more truths of efficiency. A good chunk of energy could be going into cooling servers, some gets lost in transformers, and then a tiny part are being used to do actual work. The Power Usage Effectiveness calculator cuts through the cloudiness by splitting out overhead from IT load. Not just a ratio, it’s an audit of exactly where all that money vanish before reaching a chip.
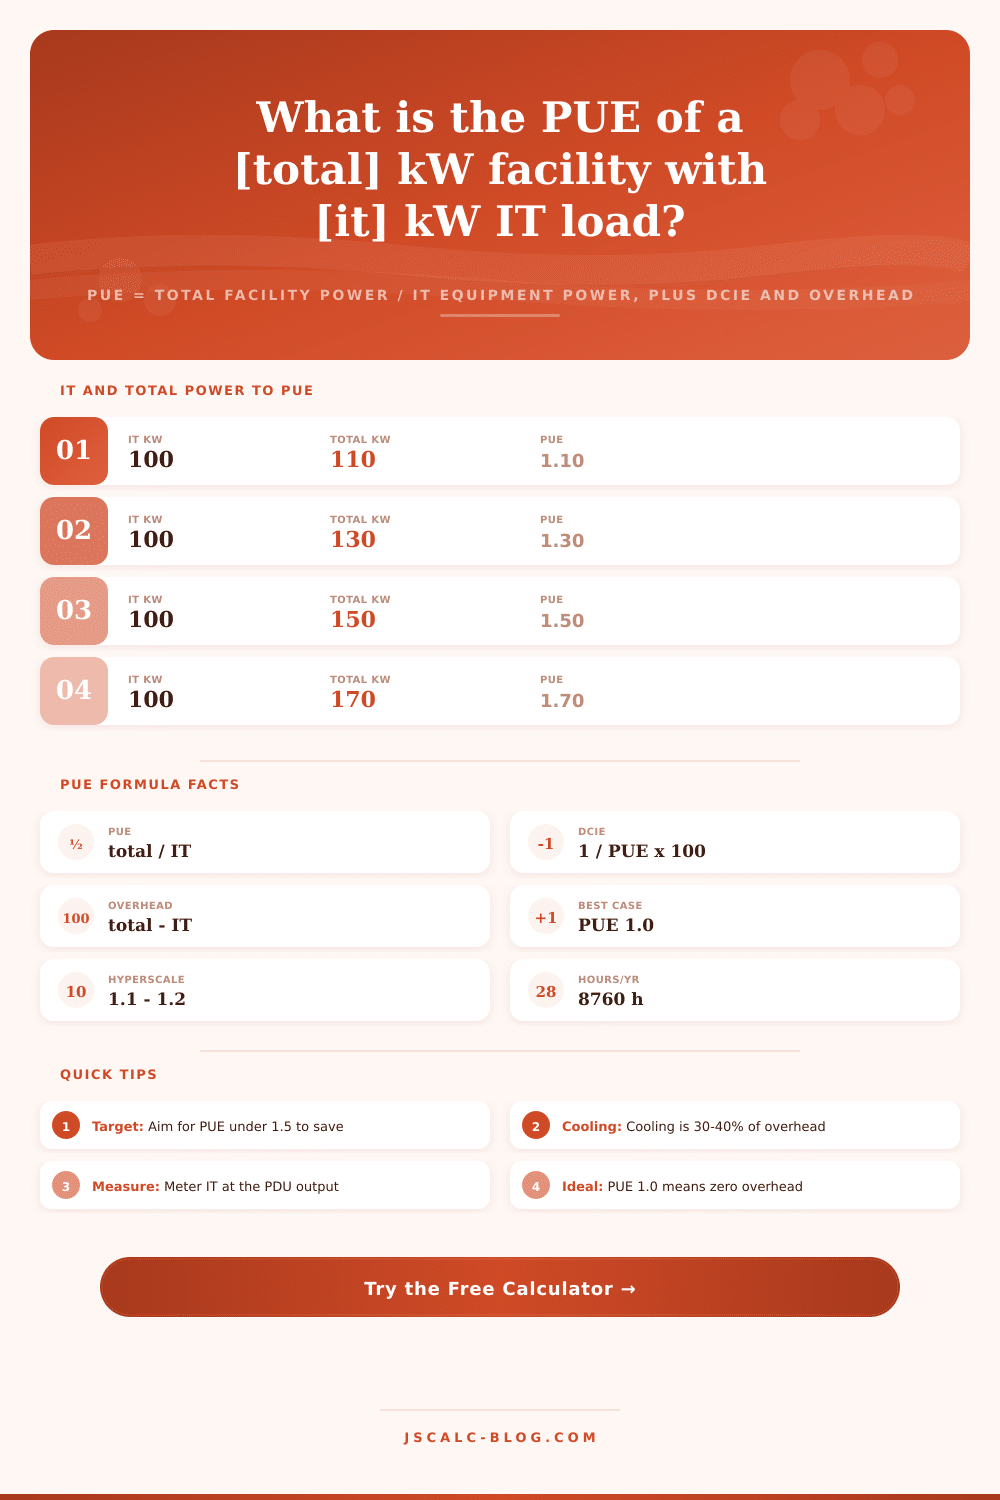
In simple terms, PUE equals total facility power ÷ IT equipment power. The ideal PUE = 1.0 (i.e., no waste). This is theoretically possible but not physically possible in any building, because the laws of physics demand some loss from distribution and cooling. When you hear someone say their PUE is 2.0, half the energy dollar go into the infrastructure, rather than the computing.
Why PUE Matters for Data Centers
Most facility managers overlook this when comparing facilities. They only look at total kilowatts and think bigger is better. They don’t realize it’s possible for a large facility to be efficient if IT density is enough to lower the overhead ratio. This is something you can construct in one of two ways using the tool. First, you can break it down into individual loads (lighting, cooling, power distribution losses) and enter those separately. Or you can simply plug in your total from a meter.
The reason breaking it down is important is that if all you know is that you have a PUE of 1.6, you don’t know what part of your datacenter are wasteful. Is it leaky UPS systems? Inefficient chillers? Sixty to seventy-five percent of non-IT power typically goes to cooling, which means this is an easy place to find improvement. Adding aisle containment and raising the temperature of supply air will drop PUE quicker than replacing servers.
The calculator also spits out the other number: DCiE (Data Center Infrastructure Efficiency). That’s one over PUE, but as a percentage. If your PUE were 1.5, then your DCiE would of been sixty-six point seven percent. Some people prefer the ratio because it is more precise, but others like the percentage. This is because they find it easier to understand that something is “eighty percent efficient” rather than seeing a decimal. Yet it describe exactly the same thing.
The overhead card provides a real number (in this case, kilowatts) that are being wasted and thus provides a concrete goal for energy reduction projects instead of an unclear benchmark. The interface shows your numbers and has presets to put them into context. For example, traditional enterprise rooms is typically around 1.6 (or worse) due to older CRAC units and lousy air flow management. At the other end of the spectrum, hyperscale clouds use liquid immersion and free cooling, achieving a 1.10 or better.
It’s clear that both scale and climate determine limits on efficiency: it just makes sense when comparing a tiny server closet with a PUE of 2.5 to a Nordic data center at 1.15. You might not be able to beat the laws of thermodynamics, but don’t shoot yourself in the foot by having an overly large HVAC plant or lack of good containment.
These ratios become important when translated into annual energy figures. To figure out the kilowatt-hour impact, multiply the total power by eight thousand seven hundred sixty hours (the default: all year). Then compare that against your average utility rate. For example, a.3 difference between PUE 1.4 and 1.8 is worth thousands of dollars of wasted cooling each year. The calculator does the arithmetic for you, so you don’t have to look at spreadsheets or anything, just worry about whether an upgrade will pay itself back with energy savings.
PUE isn’t about making servers use less: It’s about making the difference between what they consume and the total draw smaller. Other ways to reduce losses include using LED lighting, higher voltage distribution, and eco-mode UPS units. Big gains comes from cooling optimization. Don’t take PUE too seriously (it’s a diagnostic tool, not a badge of honor) or measure in the wrong places, and don’t look just at monthly averages but rather average across an entire year, which smooths out seasonal swings. Just make sure more watts is working than warming the air around them.