Server Power Consumption Calculator
Estimate IT load, wall-plug watts after PSU efficiency loss, annual kWh, heat output in BTU per hour, and per-circuit amps at 120V and 208V from CPU, RAM, drive, and GPU component wattage.
🖥Real Server Presets
📝Server Build Inputs
Desktop 65W, server 105–150W, high-core 250–350W.
DDR4 near 3W, DDR5 or RDIMM near 5–7W each.
Inference cards 70–150W, training GPUs 300–700W.
Board, fans, NIC, BMC, and chipset overhead.
Idle 15–30%, steady 50–70%, benchmark 90–100%.
Enterprise 1.5–2.0, efficient hyperscale near 1.1.
🔢Power Snapshot
🔌Component Wattage Reference
| Component | Idle Watts | Load Watts | Count Basis | Notes |
|---|---|---|---|---|
| Desktop-class CPU | 10–20 W | 65–95 W | Per socket | Ryzen or Core i5/i7 tier |
| Server CPU (mid) | 25–40 W | 105–150 W | Per socket | Xeon Silver, EPYC 16–32 core |
| Server CPU (high) | 50–80 W | 250–350 W | Per socket | 64+ core flagship parts |
| DDR4 DIMM | 2 W | 3 W | Per stick | Unbuffered desktop memory |
| DDR5 / RDIMM | 3 W | 5–7 W | Per stick | Registered ECC server memory |
| 3.5in HDD | 4–6 W | 8–10 W | Per drive | Spins higher on seek and startup |
| 2.5in SATA SSD | 0.5 W | 3 W | Per drive | Very low idle draw |
| NVMe SSD | 1–2 W | 7–9 W | Per drive | Bursts high on sustained writes |
| Inference GPU | 15–30 W | 70–150 W | Per card | T4, L4, small accelerators |
| Training GPU | 50–100 W | 300–700 W | Per card | A100, H100, MI300 class |
| Motherboard base | 30–50 W | 50–90 W | Per server | Board, fans, NIC, BMC, chipset |
⚡80 PLUS Efficiency Reference
| 80 PLUS Tier | Eff at 50% Load | Loss on 500W IT | Wall Watts | Typical Use |
|---|---|---|---|---|
| Generic (no cert) | ~80% | 125 W | 625 W | Budget desktop supplies |
| 80 PLUS Bronze | ~85% | 88 W | 588 W | Entry servers and workstations |
| 80 PLUS Silver | ~88% | 68 W | 568 W | Small business servers |
| 80 PLUS Gold | ~90% | 56 W | 556 W | Most rack servers today |
| 80 PLUS Platinum | ~92% | 43 W | 543 W | Dense and hyperscale racks |
| 80 PLUS Titanium | ~94% | 32 W | 532 W | Efficiency-critical datacenters |
🌡Energy, Heat, and Rack Density
| Wall Power | kWh / Day | kWh / Year | Heat BTU/hr | Amps 120V | Amps 208V |
|---|---|---|---|---|---|
| 150 W | 3.6 | 1,314 | 512 | 1.3 | 0.7 |
| 300 W | 7.2 | 2,628 | 1,024 | 2.5 | 1.4 |
| 500 W | 12.0 | 4,380 | 1,706 | 4.2 | 2.4 |
| 750 W | 18.0 | 6,570 | 2,559 | 6.3 | 3.6 |
| 1,200 W | 28.8 | 10,512 | 4,094 | 10.0 | 5.8 |
| 3,500 W (rack) | 84.0 | 30,660 | 11,942 | 29.2 | 16.8 |
| 7,000 W (rack) | 168.0 | 61,320 | 23,884 | 58.3 | 33.7 |
🗂Server Type Comparison Grid
| Server Type | CPUs | Drives | GPUs | Est. IT Load | Wall Watts | kWh/Year |
|---|---|---|---|---|---|---|
| 1U web / app node | 1 | 2 SSD | 0 | ~180 W | ~200 W | ~1,750 |
| Dual-CPU database | 2 | 8 SSD | 0 | ~480 W | ~530 W | ~4,640 |
| GPU AI trainer | 2 | 4 NVMe | 4 | ~1,900 W | ~2,100 W | ~18,400 |
| Home NAS | 1 | 6 HDD | 0 | ~120 W | ~145 W | ~1,270 |
| Blade chassis (8) | 16 | 16 SSD | 0 | ~2,600 W | ~2,850 W | ~24,900 |
| Storage array | 2 | 60 HDD | 0 | ~750 W | ~830 W | ~7,270 |
| Full 42U rack | Mixed | Mixed | Mixed | ~6,300 W | ~7,000 W | ~61,300 |
⚙Full Formula Breakdown
📋Reference Values
| Item | Common Value | How It Is Used | Effect on Result |
|---|---|---|---|
| Load factor | 15% to 100% | Scales the component sum | Lower load cuts watts, kWh, and heat |
| PSU efficiency | 80% to 94% | Divides IT load to get wall | Higher tier lowers wall watts and loss |
| Rack circuit | 20A or 30A | Compared to computed amps | Cap continuous load near 80% of breaker |
| Electricity rate | $0.10 to $0.30 | Multiplied by annual kWh | Sets yearly energy cost per server |
| PUE | 1.1 to 2.0 | Multiplies IT wall power | Adds cooling and distribution overhead |
💡Practical Power Tips
The memory bandwidth and cores are why you bought the server. Kilowatts weren’t on the list. That’s a promise of what it will do, assuming that you leave it plugged in. Clock speed doesn’t matter when it comes time to pay the bill. What matters is that thing plugging into the wall.
If you learn the distinction between wall draw and IT load, you’ll have a better chance of keeping your home closet or data center from becoming a furnace. Plug your component wattages into the calculator, and let it handle the math. No more guesswork as to how many amps is really running through that PDU.
Why You Need to Plan Your Server Power Use
People see TDP numbers on a spec sheet, and think that’s what shows up on their power bill. Nope. Unless someone is torturing a benchmark out of the CPU, very few thing ever run anywhere near there 150 watt rating. Often servers sits at half or less than peak thermal design power in steady state workloads. They size their circuits/cooling based off the worst case that never happens. Worse yet, they size for idle and trip breakers when doing a backup job.
The silent tax is in the power supply efficiency. An old unit that’s running at eighty percent efficiency will burn twenty percent of its electricity input as wasted heat long before it hits the silicon. A titanium or platinum certified unit sounds like an incremental upgrade on the spec sheet. In a crowded rack, however, those percentage points equate to real money leaking out the air handling unit. This loss is accounted for by the calculator automaticly. Rather than seeing only what motherboard asks for, it tells you true cost at the meter.
The certain consequence of every watt you consume are heat. Each joule of power turns into heat that your HVAC system has to suck away. If you run a high-density GPU rack to train AI, your air conditioning bill can easily dwarf the cost of the servers themselves over time. So this tool lets you translate watts into BTU/hour so you can speak with your facilities team using there lingo. They don’t care about teraflops. They care about tons of cooling capacity. Underestimating your thermal load mean hot spots. Hot spots mean throttling. Throttling means missed SLAs.
Circuit management is another minefield for beginners. Twenty amps seems like that’s enough for a few server. Electrical codes, however, typically require that continuous loads not exceeds 80% of the capacity of their breakers. That means only sixteen amps of safety margin. Throw a bunch of high-power nodes in a single rack and don’t double-check the total draw, and you’re setting yourself up for a nuisance trip at an inconvenient moment, say, the busiest time of day. It’s a little thing, but oh how it hurts if you’re trying to maintain uptime guarantees.
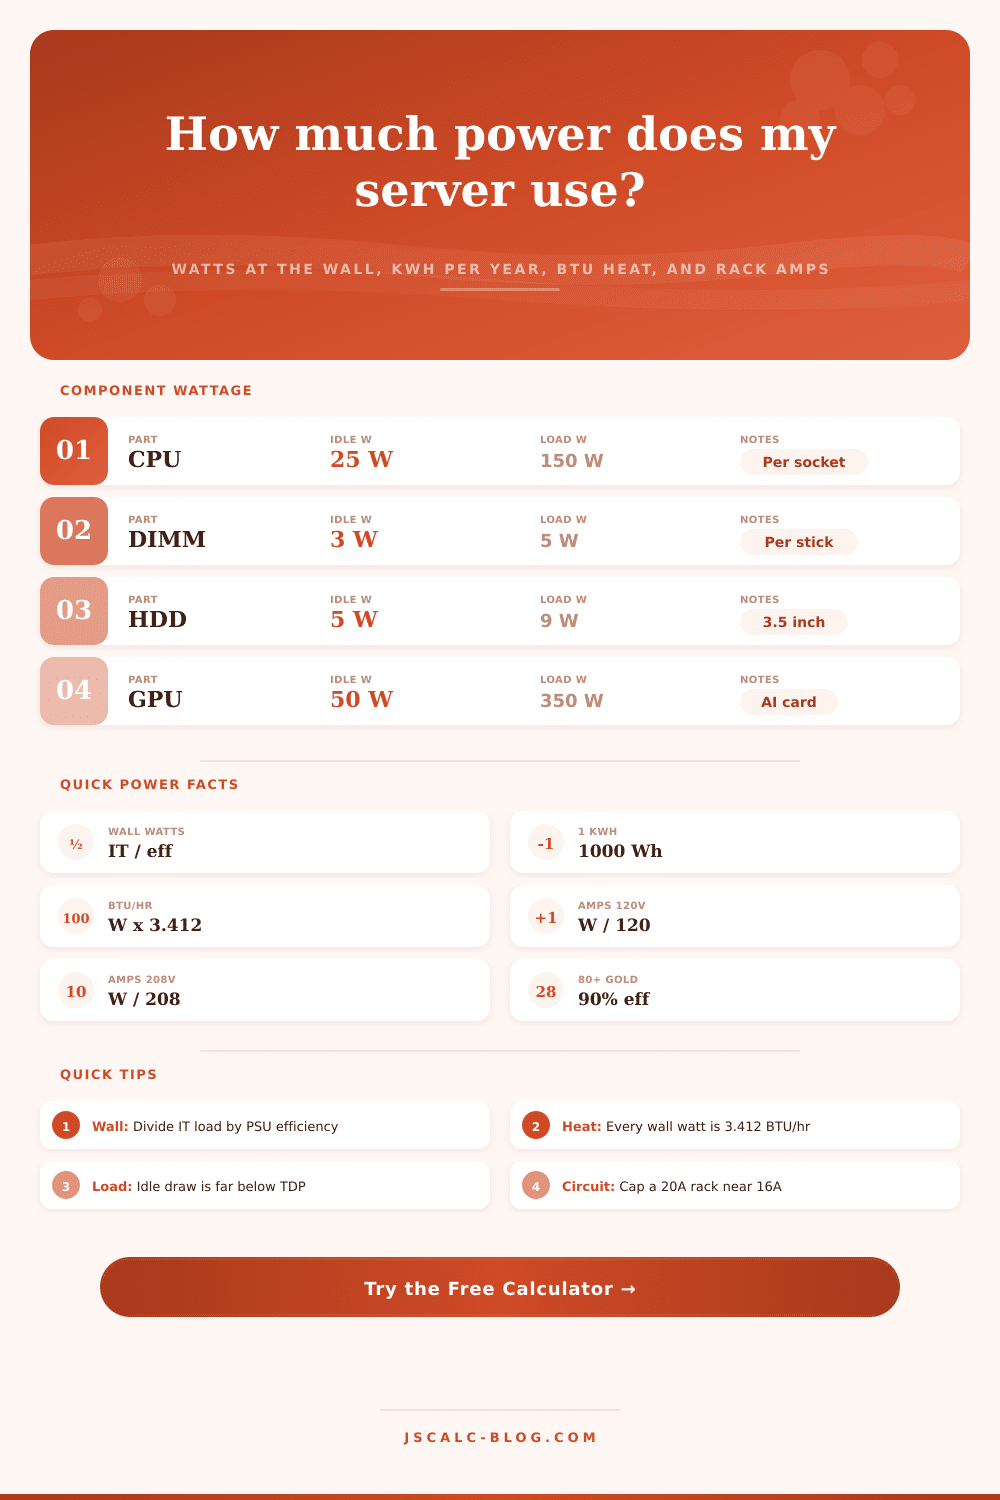
The page features a reference table that breaks down typical server elements, from large storage arrays to desktop-class CPUs. Take that and run it through as a sanity check on your gear. Are those drives spinning up? Is that GPU idling, or is it busy training away? That can make a huge difference in the overall draw. An idle all-flash server is going to be much different then a home NAS with half a dozen spinning hard drives starting up. That’s often the tipping point for getting a dedicated circuit vs sharing.
In the end it’s all about capacity and reality: You don’t need to memorize the wattage of each fan curve. You do need to see that efficiency ratings compounds across thousands of servers. Saving a few watts per node adds up to megawatts at scale. Whether it’s provisioning a new cloud region or adding one more unit to your office rack, the physics are stubbornly consistent. Power enters via the cord, turns into heat and work, and leaves as a monthly invoice.
How many times have you put off seeing your utility bill? You turn on the computer. It processes information. It uses electricity to create heat. Then you recieve the bill after the fact.
Power management takes care of keeping your servers humming along while not bursting their budgets and blowing fuses. Plan for power usage in advance so you can make sure your data center has the juice to support what you need to get done. Buy a server for its performance; manage power carefuly to keep it running. That’s how you get online.