Sales Win Rate Calculator
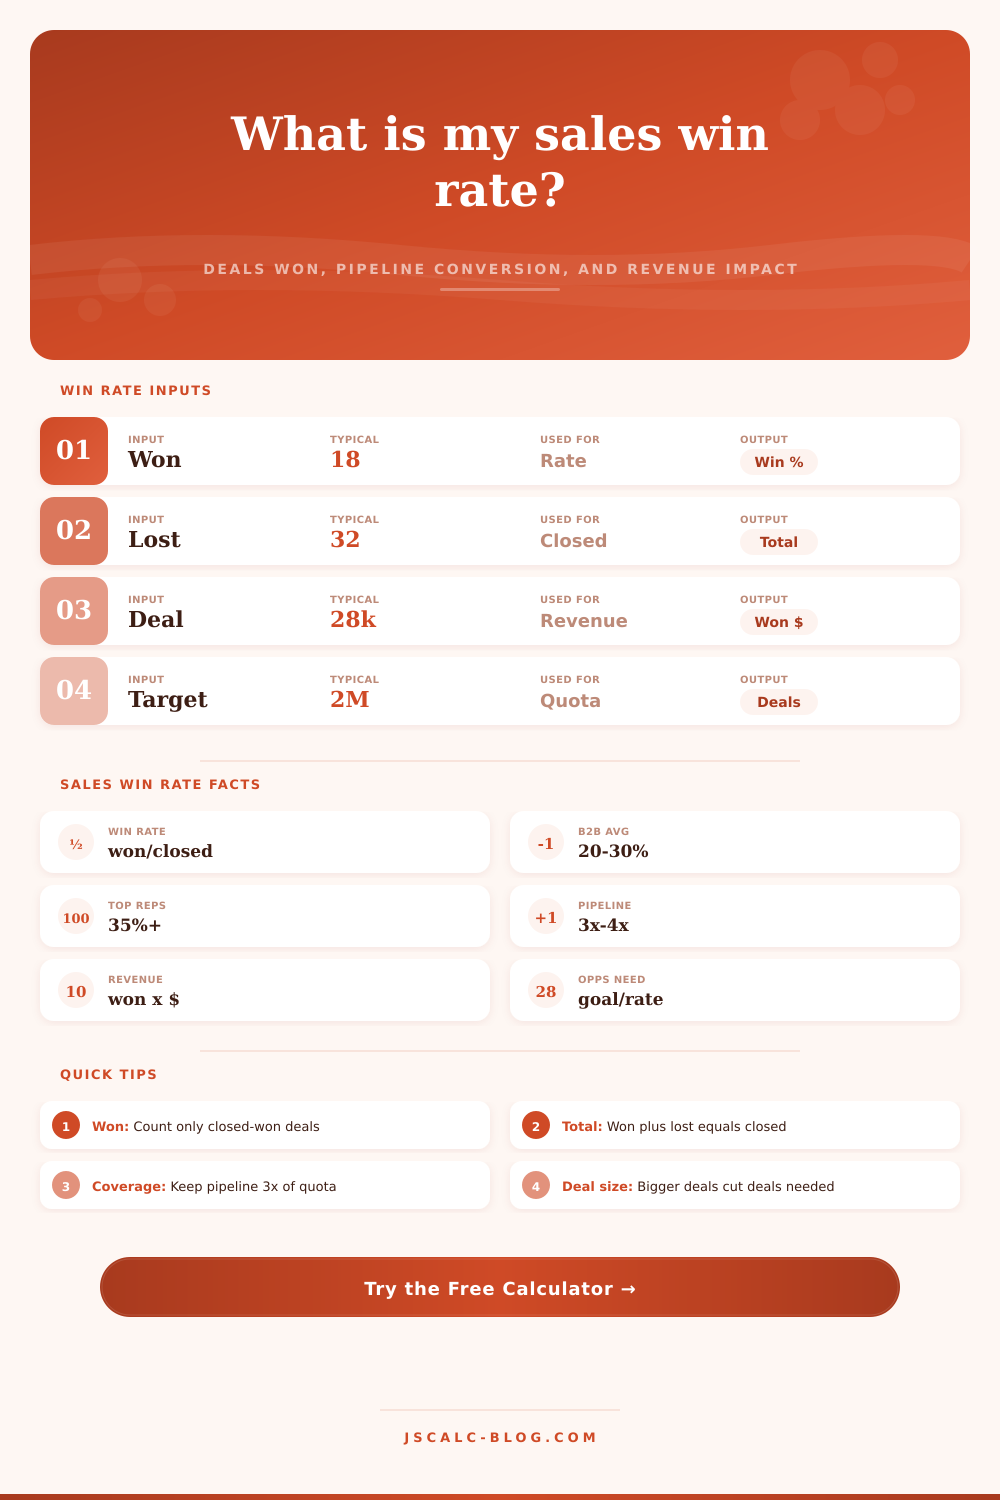
Measure closed-won versus total closed deals, opportunity conversion, average deal size, revenue won, pipeline coverage, and how many opportunities you need to hit a B2B revenue target.
🎯Real Sales Scenarios
📝Sales Inputs
Closed basis ignores open deals; opportunity basis uses every deal in the funnel.
Total opportunities = won + lost + open when using the opportunity basis.
Open weighted or unweighted pipeline used for coverage ratio.
Used to show opportunities needed if you lift the rate.
🔢Formula Snapshot
📊Win Rate Benchmarks by Industry
| Industry / Segment | Typical Win Rate | Avg Deal Size | Sales Cycle | Pipeline Coverage |
|---|---|---|---|---|
| B2B SaaS (SMB) | 22% to 30% | $8k to $25k | 21 to 45 days | 3.0x to 3.5x |
| B2B SaaS (Mid-market) | 18% to 26% | $25k to $75k | 45 to 90 days | 3.5x to 4.0x |
| Enterprise software | 12% to 20% | $75k to $500k | 90 to 180 days | 4.0x to 5.0x |
| Professional services | 25% to 40% | $15k to $120k | 30 to 75 days | 2.5x to 3.5x |
| Manufacturing / industrial | 25% to 35% | $20k to $250k | 60 to 150 days | 3.0x to 4.0x |
| Financial services | 15% to 25% | $30k to $200k | 45 to 120 days | 3.5x to 4.5x |
| Inbound-led / PLG | 30% to 45% | $3k to $15k | 7 to 30 days | 2.5x to 3.0x |
🎯Deals Needed for Target Reference
| Revenue Target | Avg Deal $10k | Avg Deal $25k | Avg Deal $50k | Avg Deal $100k |
|---|---|---|---|---|
| $500,000 | 50 wins | 20 wins | 10 wins | 5 wins |
| $1,000,000 | 100 wins | 40 wins | 20 wins | 10 wins |
| $2,000,000 | 200 wins | 80 wins | 40 wins | 20 wins |
| $3,500,000 | 350 wins | 140 wins | 70 wins | 35 wins |
| $5,000,000 | 500 wins | 200 wins | 100 wins | 50 wins |
| $10,000,000 | 1,000 wins | 400 wins | 200 wins | 100 wins |
📈Pipeline Coverage Reference
| Coverage Ratio | Pipeline vs Quota | Health Signal | Implied Win Rate | Recommended Action |
|---|---|---|---|---|
| Below 2.0x | Under-covered | At risk | Needs 50%+ | Build pipeline urgently |
| 2.0x to 2.9x | Thin coverage | Caution | Around 35% | Add top-of-funnel volume |
| 3.0x to 3.9x | Healthy | On track | About 25% to 33% | Maintain and qualify hard |
| 4.0x to 4.9x | Strong buffer | Comfortable | About 20% to 25% | Focus on cycle speed |
| 5.0x or higher | Over-covered | Possible bloat | Under 20% | Prune stale, low-quality deals |
🗂Win Rate vs Deal Size Comparison Grid
| Scenario | Win Rate | Avg Deal | Won / Closed | Revenue Won | Opps for $2M |
|---|---|---|---|---|---|
| SaaS 25% Win | 26.5% | $28k | 18 / 68 | $504k | 270 opps |
| Enterprise Deals | 18.0% | $120k | 9 / 50 | $1.08M | 93 opps |
| SMB High Volume | 36.0% | $9k | 90 / 250 | $810k | 618 opps |
| Reach 30% goal | 30.0% | $28k | 21 / 70 | $588k | 239 opps |
| Quota Planning | 25.0% | $40k | 25 / 100 | $1.00M | 200 opps |
| Q4 Push | 28.0% | $35k | 28 / 100 | $980k | 204 opps |
| Rep Performance | 33.3% | $32k | 15 / 45 | $480k | 188 opps |
⚙Full Formula Breakdown
📋Reference Values
| Metric | Common Range | How It Is Used | Revenue Effect |
|---|---|---|---|
| Deals won | 5 to 500 per period | Numerator of win rate | Drives revenue won directly |
| Deals lost | Varies by funnel | Adds to total closed | Lowers the win rate |
| Average deal size | $3k to $500k | Revenue per win | Bigger deals cut deals needed |
| Revenue target | $100k to $50M | Goal for the period | Sets deals and opps needed |
| Pipeline value | 2x to 5x quota | Coverage numerator | Buffer against lost deals |
| Sales cycle | 7 to 180 days | Time per deal | Affects timing, not the ratio |
💡Practical Win Rate Tips
Your quota isn’t looking good, despite an impressive-looking pipeline. Your CRM say you should close double your revenue, but your bank account says otherwise. Why? Chances are, the reason lies in the way you understand, or don’t understand, what your company’s win rate represent, and how it correlates to volume and deal size.
Win rate isn’t some vanity metric reserved only for top-performers bragging rights. It’s the single most important conversion factor indicating if your team will have enough fuel at the quarter-end to get to finish line. After plugging in your revenue goals, average ticket size, and closed deal information into calculator above, it do all the heavy lifting for you. It will cut out the noise of your open opportunities and leave you with bare-bones view of how efficiently you converted your closed activity.
How to Calculate Your True Win Rate
The most common mistake that most teams make is using every qualified lead as denominator (i.e., they are mixing closed-won deals with open deals that have not been fully evaluated). That leads them to artificialy inflate their win rates because they’re mixing apples-to-oranges: they’re measuring their winning skill against deals that don’t even passes the full evaluation process yet.
To calculate the true win rate, divide the number of deals marked “won” by total number of deals specifically marked “lost” or “won.” Ignore the rest of your open pipeline. This is why it feels counterintuitive; ignoring half of what’s in your CRM. But it’s necessary if you want an honest picture of your closing skill different than your pipeline generation effort.
Take the example of an enterprise account executive vs. A high-volume SMB seller. While the former has to navigate more complicated buying committees and longer sales cycles, the latter wins thirty-five percent of the deals they close (a great number), but not so great when you consider those deals is for ten-thousand-dollar contracts. To make their annual goal of two million dollars, the SMB rep would of have to close twenty deals. If that’s their win-rate, they’ll need to create and close more than fifty-seven opportunities to keep up with quota.
Meanwhile, the enterprise rep might only win fifteen percent of their closed deals. But each deal averages one hundred thousand dollars. So in order to meet same two-million dollar quota, the enterprise rep need to close only twenty deals. They convert from opportunity to won at a fraction of the volume than the SMB rep, yet they require much fewer overall opportunities to achieve success.
That’s where pipeline coverage matters: it provide the mass of raw opportunity that can soak up those misses and protect your revenue prediction from exposure. At a high level, I’d suggest aiming for three times quota in terms of qualified pipeline value. Anything less than two times (and particularly less than one) put you at significant risk of missing plan, unless you have some gigantic deal fall into your lap like gift from heaven.
The page has some reference tables showing how these ratios change by sales motion and industry segment. For example, SaaS companies tend to be more velocity-driven with a little bit lower coverage requirements vs. This is compared to a manufacturer that has a six-month sales cycle. Knowing where your model fall will help you calibrate what “good” looks like for your team.
The danger with obsessing over driving the percentage up, though, is that you risk overlooking the quality of deals won. Maybe you have a low win rate because your prospecting engine sucks in a lot of raw, unqualified leads. A twenty percent win rate on the right set of accounts is far superior to a forty percent win rate from folks who had no intention of buying in the first place.
The calculator lets you modify the target quota and deal size independently. You’ll be able to see what your life would look like if you could get better at closing. You can also see how much it would ease your burden if you could package or upsell your way to higher average contract values.
A sales win rate calculator is really just a diagnostic. If there’s a leak in your funnel, this will point out where it is and allow you to fix it. I’ve found that making small changes to your qualification criteria has far more impact than spending hours teaching salespeople how to close better. Stay consistent with your definitions, be accurate when tracking closed won vs lost, and allow the math to dictate where you put resources.
The closer the numbers gets to reality, the less like it’s a guessing game and the more it feels like hitting quota is simply a matter of disciplined execution.