RF Link Budget Calculator
Work out whether a wireless link closes. Enter transmit power, antenna gains, cable losses, distance, and frequency, and this tool computes EIRP, free space path loss (FSPL), the received signal power at the far end, and the link margin against your receiver sensitivity so you know if the path has enough spare decibels.
📶Real Link Presets
📡Link Inputs
Power at the radio output. 20 dBm = 100 mW, 30 dBm = 1 W.
Directional gain of the transmit antenna in dBi.
Feedline plus connector loss on the transmit side.
Line of sight path length between the two antennas.
Applies to the distance value above.
Center frequency of the RF carrier.
Applies to the frequency value above.
Directional gain of the receive antenna in dBi.
Feedline plus connector loss on the receive side.
Rain, foliage, polarization, and pointing losses combined.
Minimum usable signal for the chosen data rate, negative.
Spare margin target for reliability, often 10 to 20 dB.
🔢Formula Snapshot
📋Path Loss by Distance and Frequency
| Distance | Frequency | FSPL (dB) | Reads As |
|---|---|---|---|
| 100 m | 2400 MHz | 80.1 dB | Indoor hop |
| 1 km | 900 MHz | 91.5 dB | Short UHF |
| 1 km | 2400 MHz | 100.1 dB | Wi-Fi PtP |
| 1 km | 5800 MHz | 107.7 dB | 5 GHz bridge |
| 5 km | 915 MHz | 105.7 dB | LoRa town |
| 10 km | 5800 MHz | 127.7 dB | Long 5 GHz |
| 40 km | 150 MHz | 108.0 dB | VHF range |
| 100 km | 14 GHz | 155.3 dB | Microwave |
🔌Transmit Power and Antenna Reference
| Item | Value in dB | Linear Equivalent | Where Seen |
|---|---|---|---|
| Tx power | 0 dBm | 1 mW | Weak beacon |
| Tx power | 20 dBm | 100 mW | Wi-Fi radio |
| Tx power | 30 dBm | 1 W (1000 mW) | PtP max EIRP feed |
| Antenna | 0 dBi | Isotropic ref | Ideal point source |
| Antenna | 2.15 dBi | Half-wave dipole | Rubber duck |
| Antenna | 24 dBi | ~250x gain | Parabolic dish |
| Cable | 3 dB loss | Halves the power | Long coax run |
📶Typical Receiver Sensitivity
| System | Band | Data Rate | Sensitivity | Note |
|---|---|---|---|---|
| Wi-Fi 802.11n | 2.4 GHz | MCS0 6.5 Mbps | -90 dBm | Robust rate |
| Wi-Fi 802.11ac | 5.8 GHz | MCS9 866 Mbps | -59 dBm | Top rate |
| LoRa SF12 | 915 MHz | ~290 bps | -137 dBm | Long range |
| LTE Cat-1 | 1800 MHz | 10 Mbps | -97 dBm | Cell edge |
| GPS L1 C/A | 1575 MHz | 50 bps | -130 dBm | Below noise |
| Zigbee | 2.4 GHz | 250 kbps | -95 dBm | IoT mesh |
| FM voice | 150 MHz | Analog NBFM | -116 dBm | 12 dB SINAD |
🗃Full Link Budget Comparison Grid
| Link | EIRP | Distance | Freq | FSPL | Rx Power | Margin |
|---|---|---|---|---|---|---|
| Wi-Fi 2.4 PtP | 30.5 dBm | 5 km | 2400 MHz | 114.1 dB | -76.1 dBm | +13.9 dB |
| Wi-Fi 5.8 bridge | 34 dBm | 10 km | 5800 MHz | 127.7 dB | -71.7 dBm | +18.3 dB |
| LoRa 915 | 16 dBm | 15 km | 915 MHz | 115.2 dB | -105.2 dBm | +31.8 dB |
| LoRa 868 | 14 dBm | 10 km | 868 MHz | 111.2 dB | -105.2 dBm | +31.8 dB |
| Cellular 1800 | 58 dBm | 3 km | 1800 MHz | 107.1 dB | -51.1 dBm | +45.9 dB |
| 14 GHz microwave | 66 dBm | 30 km | 14 GHz | 144.9 dB | -84.9 dBm | +5.1 dB |
| VHF 150 voice | 44 dBm | 40 km | 150 MHz | 108.0 dB | -67.0 dBm | +49.0 dB |
| UAV 2.4 control | 26 dBm | 2 km | 2400 MHz | 106.1 dB | -83.1 dBm | +11.9 dB |
| Sat IoT S-band | 20 dBm | 780 km | 2200 MHz | 157.1 dB | -134.1 dBm | +2.9 dB |
| GPS L1 | 27 dBm | 20200 km | 1575 MHz | 182.5 dB | -152.5 dBm | -22.5 dB |
⚙Formula Breakdown
💡Link Planning Tips
When two radios talk to each other over a radio link, they use a running tally of decibels called a radio frequency link budget. This budget accounts for everything that adds to or subtracts from a signal during it’s trip from one radio to another. This RF link budget calculator do that math for you. Plug in the frequency, distance, transmit power, antenna gain, cable losses, etc., and it spits back four numbers that determine if your wireless link will close successfuly.
If the number is comfortabley positive, then there’s enough power to get the job done. If it’s negative, no amount of wishful thinking will help. That budget, that running tally in decibels… Is what every wireless system lives or dies by. Transmitters can only push so much power (under regulatory caps) and receivers can only pull a signal out of noise down to some fixed sensitivity limit. In between those limits lies the path, which steal decibels via weather, distance, frequency, and cables.
How to Calculate Your Wireless Signal Strength
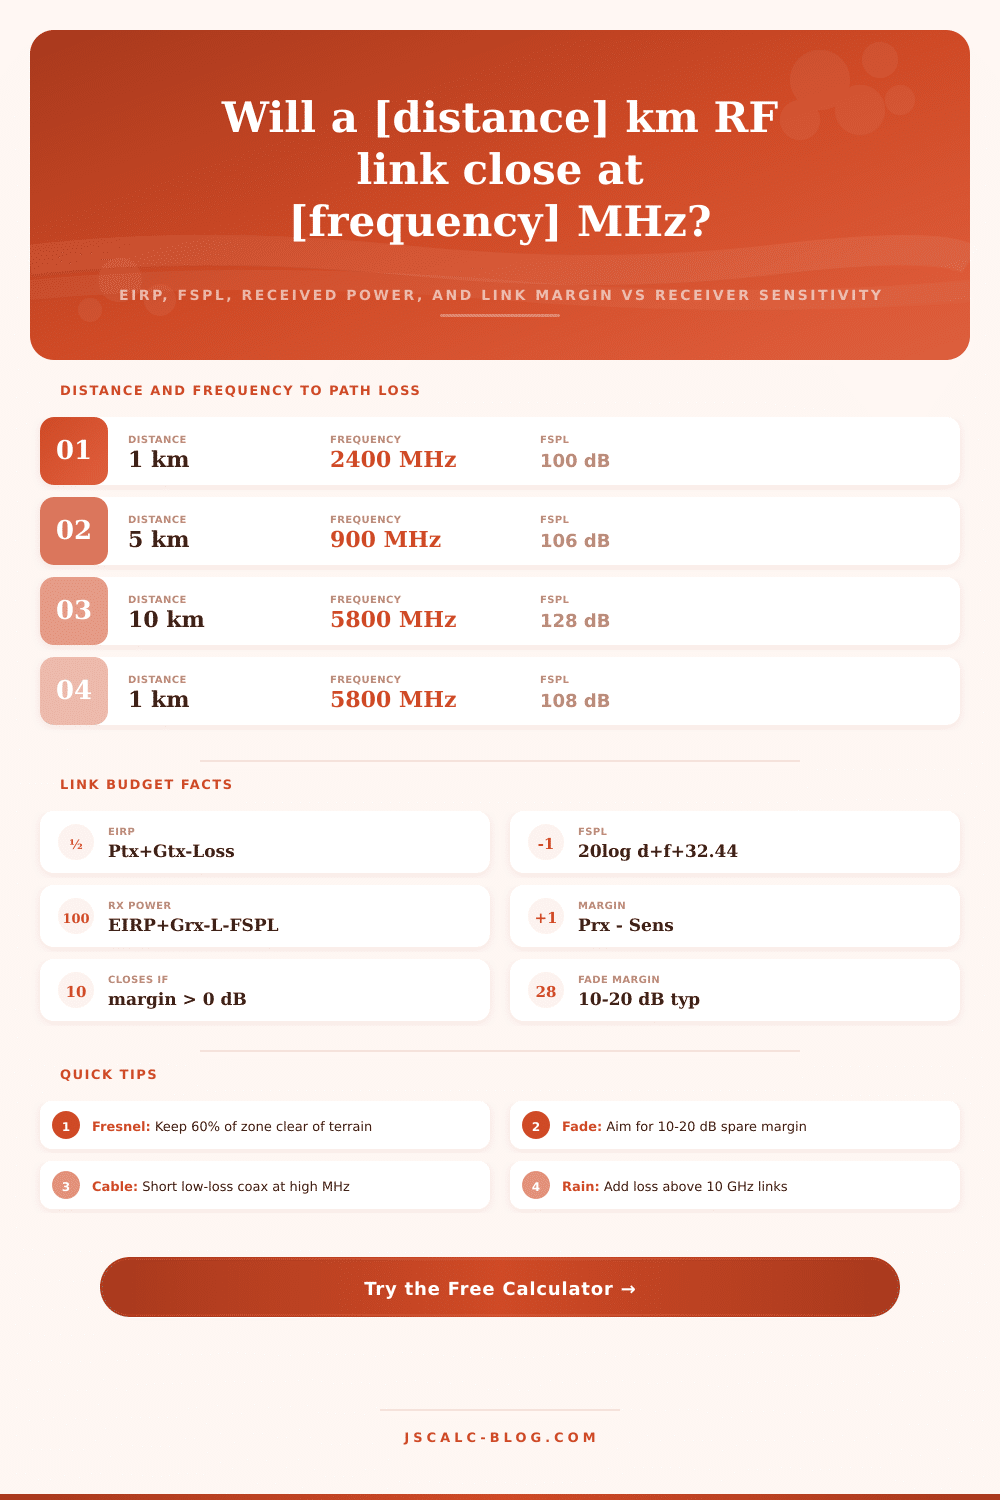
How do we calculate that? The first result is EIRP, effective isotropic radiated power. In other words, it tell you how much power your antenna system actualy sends out in its best direction compared to a hypothetical transmitter that sends the same amount in all directions. It’s the radio output + the transmit antenna gain, the loss from any cabling linking those two together. If you have a 20 dBm radio powering a 12 dBi antenna via a 1.5 dB of cabling, then you get an EIRP of 30.5 dBm. This is what you’re effectively launching off-site. Regulators are frequently interested in this value so they can ensure you don’t interfere with others’ networks.
Free space path loss, the next item in the list, is typically the largest contribution to the entire formula. Since a radio wave is spread out as it travels, its power density decreases according to the inverse of the square of distance traveled, that’s what it means for power to fall off at a rate of R-squared. In other words, every doubling of distance (or frequency) add another 6 dBs of loss. This is also why antennas must be larger for high-frequency links; they has to get more signal into the air to achieve comparable ranges. Plug in your own carrier frequency and hop length, and the calculator does the math for you. You won’t have unit mismatches or should of had to do logarithmic conversions by hand.
Third is what we call “received power”. I.e., how much signal is actualy at your receiver’s input. This value begins with your EIRP and includes gain of your receive antenna. It then subtracts out path loss, receive cable loss, and any additional atmospheric loss due to foliage or rain. Because the signal is so small by the time it gets to you, the resulting number in dBm is nearly always negative. For example, a received power of -76 dBm is a healthy level for most Wi-Fi radios. Depending on your modulation scheme and data rate, other systems may find that barely noticeable.
That brings us to the last card: the link margin. This is the key for long term reliability. Simply put it’s the received power minus the receiver sensitivity. With 14 dB of margin, the connection will work. At zero, it’s just the ragged edge, a tiny bit of disturbance and down we go. Engineers say the fade margin should be at least 10 to 20 dB to withstand both antenna drift and rain fades. Does your set up clear that? That’s what the tool flags. It tells you if the link is marginal or strong.
Real-world installations use mixed units. Because of this, the tool accepts frequency input in either gigahertz or megahertz, and distance can be input in kilometers or miles. The software converts internally and applies formula for loss. This prevents errors from mixing metric frequencies used on radios with imperial measures used in site surveys. It includes built-in presets covering backhauls by microwaves, downlinks from orbit by GPS, and real systems such as LoRa nodes trading sensitivity for data rates. When you load one of these presets, you immediately get a sense of how various links compare.
For example, the GPS case is particularly helpful: Its margin appears negative when compared to simple sensitivity numbers. True navigation requires processing gain which isn’t reflected in a mere budget number. Feed it honest numbers if you want to believe what comes out. Get antenna gains from the datasheet, not a marketing brochure. The actual coax length and type at your operating frequency matter; coax loss increases steeply with frequency, and can eat away at your antenna gains slightly on long runs. Receiver sensitivity reflects the data rate you really require, not the fastest that the radio can support.
If applied carefully, it translates a bunch of disconnected specs to one clear answer: Will your link work or not? It eliminates guessing at antenna sizes and distance planning. It converts airy-fairy dreams to concrete protection from fade and interference. It makes sure your signal reaches its destination, doesn’t merely get started there.