Retirement Calculator
Project current savings growth, monthly contributions, employer match, annual contribution increases, inflation-adjusted income need, target nest egg, and any estimated retirement gap.
Used as the nominal annual growth rate before retirement.
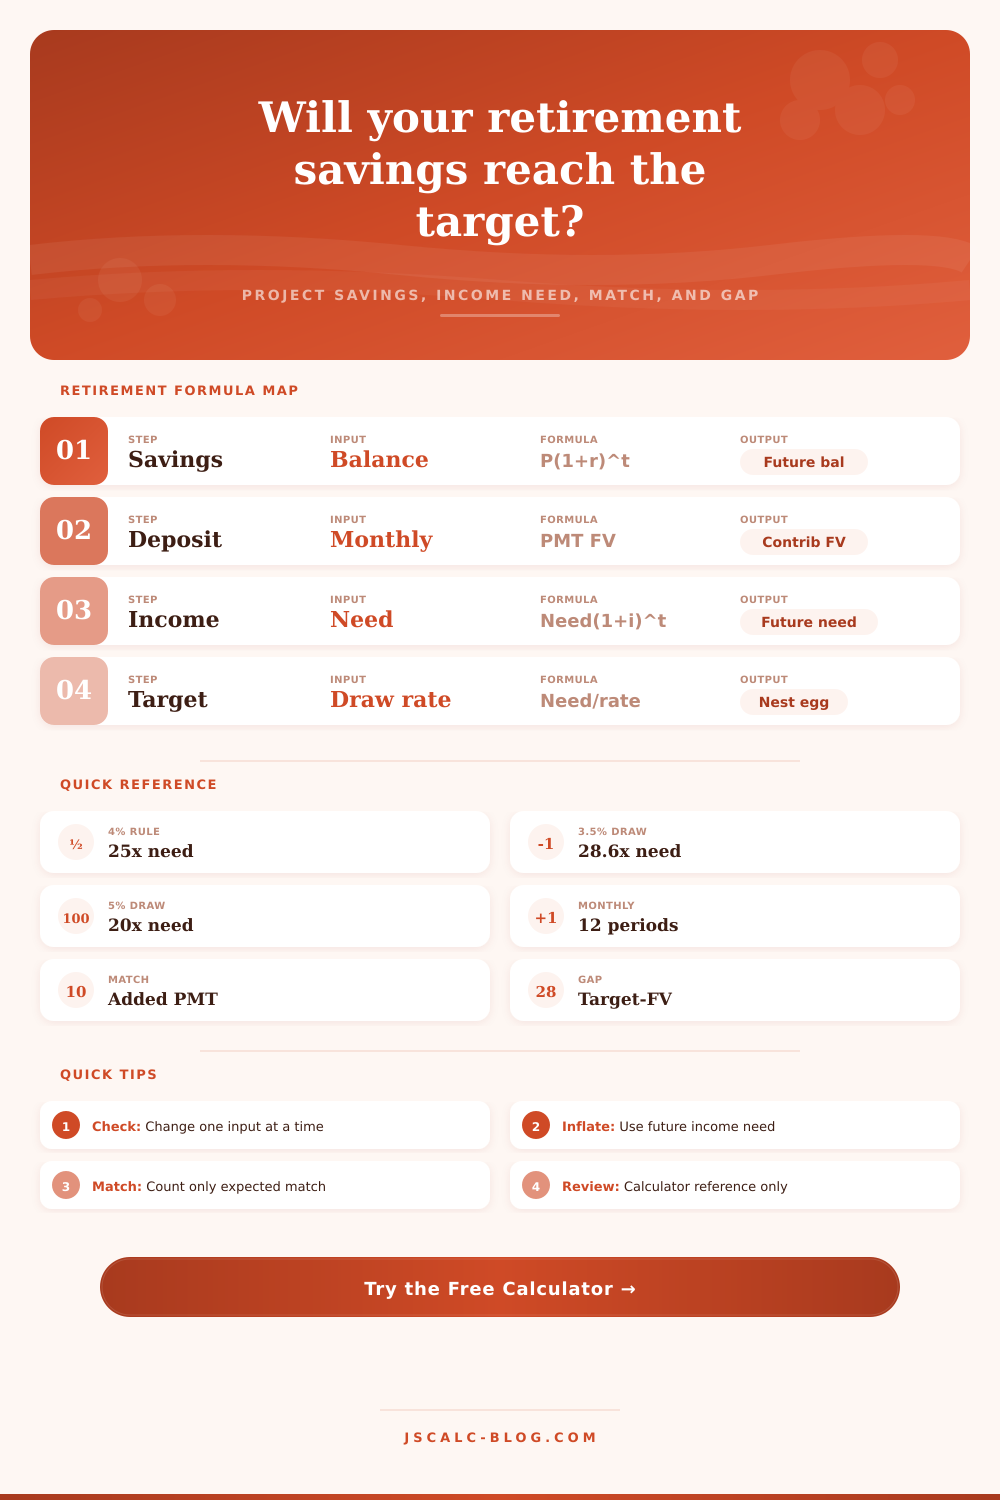
Target nest egg = future annual income need divided by withdrawal rate.
Applied once per year to personal and employer monthly contributions.
FV savings = P(1 + r)^t
P is current savings, r is expected annual return as a decimal, and t is years until retirement.
FV contributions = PMT * (((1 + i)^n - 1) / i)
i is the monthly rate from the annual return and n is total months. The calculator also runs a month-by-month projection so annual contribution increases and employer match can be included.
Future income need = today's annual need * (1 + inflation)^t
This converts the annual retirement income target into estimated first-year retirement dollars.
Target nest egg = future income need / withdrawal rate
Gap = target nest egg - projected savings
A positive gap means projected savings are below the target; a negative gap is shown as a surplus.
Total monthly contribution = personal contribution + employer match
The match is projected as an added monthly contribution, with the same annual contribution increase applied for reference.
| Withdrawal rate | Target multiple | $50k future need | $75k future need | $100k future need |
|---|---|---|---|---|
| 3.0% | 33.3x annual need | $1,666,667 | $2,500,000 | $3,333,333 |
| 3.5% | 28.6x annual need | $1,428,571 | $2,142,857 | $2,857,143 |
| 4.0% | 25.0x annual need | $1,250,000 | $1,875,000 | $2,500,000 |
| 4.5% | 22.2x annual need | $1,111,111 | $1,666,667 | $2,222,222 |
| 5.0% | 20.0x annual need | $1,000,000 | $1,500,000 | $2,000,000 |
| 6.0% | 16.7x annual need | $833,333 | $1,250,000 | $1,666,667 |
| Scenario | Age now | Retire age | Starting savings | Monthly total | Return | Projected savings |
|---|---|---|---|---|---|---|
| Early starter | 30 | 67 | $35,000 | $700 | 7.0% | $2,026,100 |
| Mid-career match | 42 | 67 | $180,000 | $1,300 | 6.5% | $1,637,900 |
| Late catch-up | 55 | 67 | $350,000 | $2,400 | 6.0% | $1,034,500 |
| Near retirement | 62 | 67 | $750,000 | $1,400 | 5.0% | $1,046,400 |
| Conservative | 45 | 67 | $220,000 | $1,100 | 4.5% | $1,014,600 |
| High saver | 38 | 65 | $300,000 | $2,500 | 7.0% | $3,310,900 |
| Self-employed | 35 | 65 | $80,000 | $1,500 | 6.5% | $2,182,700 |
| Lean target | 33 | 60 | $95,000 | $1,250 | 6.0% | $1,531,800 |
| Monthly match | Annual match | 10 years at 6% | 20 years at 6% | 30 years at 6% |
|---|---|---|---|---|
| $100 | $1,200 | $16,388 | $46,204 | $100,452 |
| $200 | $2,400 | $32,776 | $92,408 | $200,904 |
| $300 | $3,600 | $49,164 | $138,612 | $301,356 |
| $500 | $6,000 | $81,940 | $231,020 | $502,260 |
| $750 | $9,000 | $122,910 | $346,530 | $753,390 |
| $1,000 | $12,000 | $163,879 | $462,040 | $1,004,520 |
| Today's income need | Inflation | 10 years | 20 years | 30 years | 40 years |
|---|---|---|---|---|---|
| $50,000 | 2.0% | $60,950 | $74,297 | $90,568 | $110,402 |
| $50,000 | 3.0% | $67,196 | $90,306 | $121,363 | $163,102 |
| $75,000 | 2.5% | $96,006 | $122,899 | $157,568 | $202,043 |
| $75,000 | 3.5% | $105,794 | $149,245 | $210,553 | $297,055 |
| $100,000 | 2.5% | $128,008 | $163,865 | $210,091 | $269,391 |
| $100,000 | 4.0% | $148,024 | $219,112 | $324,340 | $480,102 |
When most people think about retirement, they’re thinking about a magic number. On that last day you punch out for good, they’d like to be able to look in their bank account and say: “Yep, I’m all set.” The issue is that the number we calculate today has very little resemblance to what we’ll require two decades from now. Why? Inflation slowly whittles away our purchasing power each and every year. It’s not just a question of saving more, it’s about recognizing the relationship between time, growth, and cost increases.
Don’t guess at these factors or struggle through complex compound interest calculations yourself. Instead, plug your starting age, savings balance, and projected living expenses into the calculator above. This prevents human error and lets machine do math for you.
How to Plan for Retirement
First, you should realize that inflation eats away at purchasing power. Today’s sixty-five thousand dollars per year buys a comfortable standard of livig. But fast-forward thirty years: if inflation tracks average historical levels, then your comfortable life will cost much more when you’re seventy; like, way more. Most people fails to account for this adjustment. They assume they’ll “need” a target amount based off today’s prices. Guess what happens? They fall short by a huge margin down the road.
Adjust your future-income requirement upwards to account for the true cost of groceries/housing/etc. This happen during your retirement. It’s not being pessimistic. It’s simply accounting for the reality that a heating bill or a gallon of milk doesn’t tend to decrease in price over time.
Which raises another point: Where does all this cash come from? The basis is what’s already in savings, with the rest coming at an assumed rate of return annualy. However, your steady stream of monthly deposits do the bulk of the work; particularly if you have an employer who matches your contributions. This free-money “match” compounds into your balance and adds momentum. Skipping out on this is one of the costliest financial errors we commit. By entering both the individual deposit and company adder, the visualization shows how these total cash-flows grows into wealth. A tiny habit produces big gains over three decade.
And then there is the question of how you’ll withdraw: your withdrawal strategy will affect actual amount of money you’ll need in the nest egg. Four percent is the magic number, or so conventional wisdom tells us. Therefore, you need to save 25X your spending to get by. Go for an aggressive five percent? Your target becomes twenty times the cost of living. It sounds nice at first glance. But the downside is that if you live too long or spend too quickly, you could withdraw more then you can afford and run through all your savings early. The chart above spells it out. At any given level of desired income, you must save far more if you choose a low-withdrawal strategy. It’s a two-sided proposition: want more safety? Then you’ll need a bigger nest egg.
Avoid trying to predict exactly how markets will perform. To plan, assume moderate historical averages. Anything else is optimistic (to the point of danger) or pessimistic. Consistency is more important than perfection. If you’re a little bit behind, just raise your rate of contribution each year by a few percent. You won’t catch up if you try to save big upfront; you’ll just create a bad habit. Better to start with smaller amounts and build the contribution habit then to sit on a large sum that never materializes.
In the end, however, retirement planning isn’t about reaching some specific number. It’s about tracking the things that is under your control: Is there room to increase your savings rate? Can you take advantage of your employer benefits? You can’t control market crashes, but you can control how much you save each month and whether you maximize employer benefits. Those are things you could of controlled.
The calculator helps paint a picture of what’s working, and what’s not. If it shows a surplus, great! That’s a green light. If it has a deficit, well… then you know exactly which actions to take next. Either way, at least you’ve got a number to work with instead of crossing your fingers in hopes that everything works out.
We all want to reach financial independence. Now we know exactly how long the trip will take.