Resolution Scaling Calculator
Compare any base and target resolution to see the pixel-count ratio, then estimate the GPU load and projected frame rate. Model render scale with the (render scale / 100) squared rule, preview DLSS and FSR upscaling internal resolutions, and check supersampling cost - all from one screen tuned for real-world render-scale performance.
🎯Real Scaling Scenario Presets
🖥Scaling Inputs
The resolution your known base FPS was measured at.
The output resolution you want to drive.
Horizontal pixels of the base resolution.
Vertical pixels of the base resolution.
Horizontal pixels of the output resolution.
Vertical pixels of the output resolution.
Presets set render scale automatically; Custom uses the field.
Internal render per axis; over 100% is supersampling.
Known frame rate; leave 0 to skip FPS projection.
Controls rounding on the result cards.
🔢Formula Snapshot
📊Resolution Pixel Counts
| Resolution | Dimensions | Total Pixels | Megapixels | Ratio vs 1080p |
|---|---|---|---|---|
| 720p HD | 1280 x 720 | 921,600 | 0.92 MP | 0.44x |
| 1080p FHD | 1920 x 1080 | 2,073,600 | 2.07 MP | 1.00x |
| 1440p QHD | 2560 x 1440 | 3,686,400 | 3.69 MP | 1.78x |
| UW 1440p | 3440 x 1440 | 4,953,600 | 4.95 MP | 2.39x |
| 1600p | 2560 x 1600 | 4,096,000 | 4.10 MP | 1.98x |
| 4K UHD | 3840 x 2160 | 8,294,400 | 8.29 MP | 4.00x |
| 5K | 5120 x 2880 | 14,745,600 | 14.7 MP | 7.11x |
| 8K UHD | 7680 x 4320 | 33,177,600 | 33.2 MP | 16.0x |
📏Render Scale to Pixel Fraction
| Render Scale | Per-Axis Factor | Pixel Fraction | Relative Load | Type |
|---|---|---|---|---|
| 33% | 0.33 | 0.109 (10.9%) | 0.11x | Ultra Perf |
| 50% | 0.50 | 0.250 (25.0%) | 0.25x | Performance |
| 58% | 0.58 | 0.336 (33.6%) | 0.34x | Balanced |
| 67% | 0.67 | 0.449 (44.9%) | 0.45x | Quality |
| 80% | 0.80 | 0.640 (64.0%) | 0.64x | Light drop |
| 100% | 1.00 | 1.000 (100%) | 1.00x | Native |
| 141% | 1.41 | 1.988 (199%) | 1.99x | DSR 2.0x |
| 200% | 2.00 | 4.000 (400%) | 4.00x | SSAA 4x |
⚡Upscaling Mode Internal Resolution
| Mode | Render Scale | Internal at 4K | Pixel Fraction | Approx Speedup |
|---|---|---|---|---|
| Native | 100% | 3840 x 2160 | 1.000 | 1.00x |
| Quality | 67% | 2560 x 1440 | 0.449 | ~2.23x |
| Balanced | 58% | 2227 x 1253 | 0.336 | ~2.97x |
| Performance | 50% | 1920 x 1080 | 0.250 | ~4.00x |
| Ultra Performance | 33% | 1280 x 720 | 0.109 | ~9.18x |
🗃Base to Target Scaling Comparison Grid
| Base Res | Target Res | Base MP | Target MP | Pixel Ratio | Load Multiplier | FPS @ 120 Base |
|---|---|---|---|---|---|---|
| 1080p | 1440p | 2.07 | 3.69 | 1.78x | 1.78x | 67 fps |
| 1080p | 4K | 2.07 | 8.29 | 4.00x | 4.00x | 30 fps |
| 1440p | 4K | 3.69 | 8.29 | 2.25x | 2.25x | 53 fps |
| 1440p | 1080p | 3.69 | 2.07 | 0.56x | 0.56x | 213 fps |
| 4K | 1440p | 8.29 | 3.69 | 0.44x | 0.44x | 270 fps |
| 4K | 8K | 8.29 | 33.2 | 4.00x | 4.00x | 30 fps |
| 720p | 1080p | 0.92 | 2.07 | 2.25x | 2.25x | 53 fps |
| 1080p | 8K | 2.07 | 33.2 | 16.0x | 16.0x | 8 fps |
| UW 1440p | 4K | 4.95 | 8.29 | 1.67x | 1.67x | 72 fps |
| 1440p | 5K | 3.69 | 14.7 | 4.00x | 4.00x | 30 fps |
⚙Formula Breakdown
💡Render Scale Performance Tips
With that in mind, here’s the Resolution Scaling Calculator: This lets you see how your graphics card scales with different resolutions. What happens under the hood when you turn down or up? How hard does it crunch pixel? For many people, this is the kind of math behind resolution. It’s just a slider. Higher and clearer? Lower and faster? That’s all. Without regard for cost. Because they don’t know it exists.
This tool takes away the guesswork. Instead of being about clarity, its about performance. The number of pixels you put onto screen isn’t always directly proportional to the number of pixels your GPU has to draw. This tool draws that line between your monitor and your brain, mapping rendered pixels to actual GPU load.
How Resolution Scaling Works
This matters because your GPU doesn’t charge a flat fee per resolution number. A higher number will cost you more then. The pixel count also reveals how much work your graphics card must do. And understanding it make for more efficient gameplay.
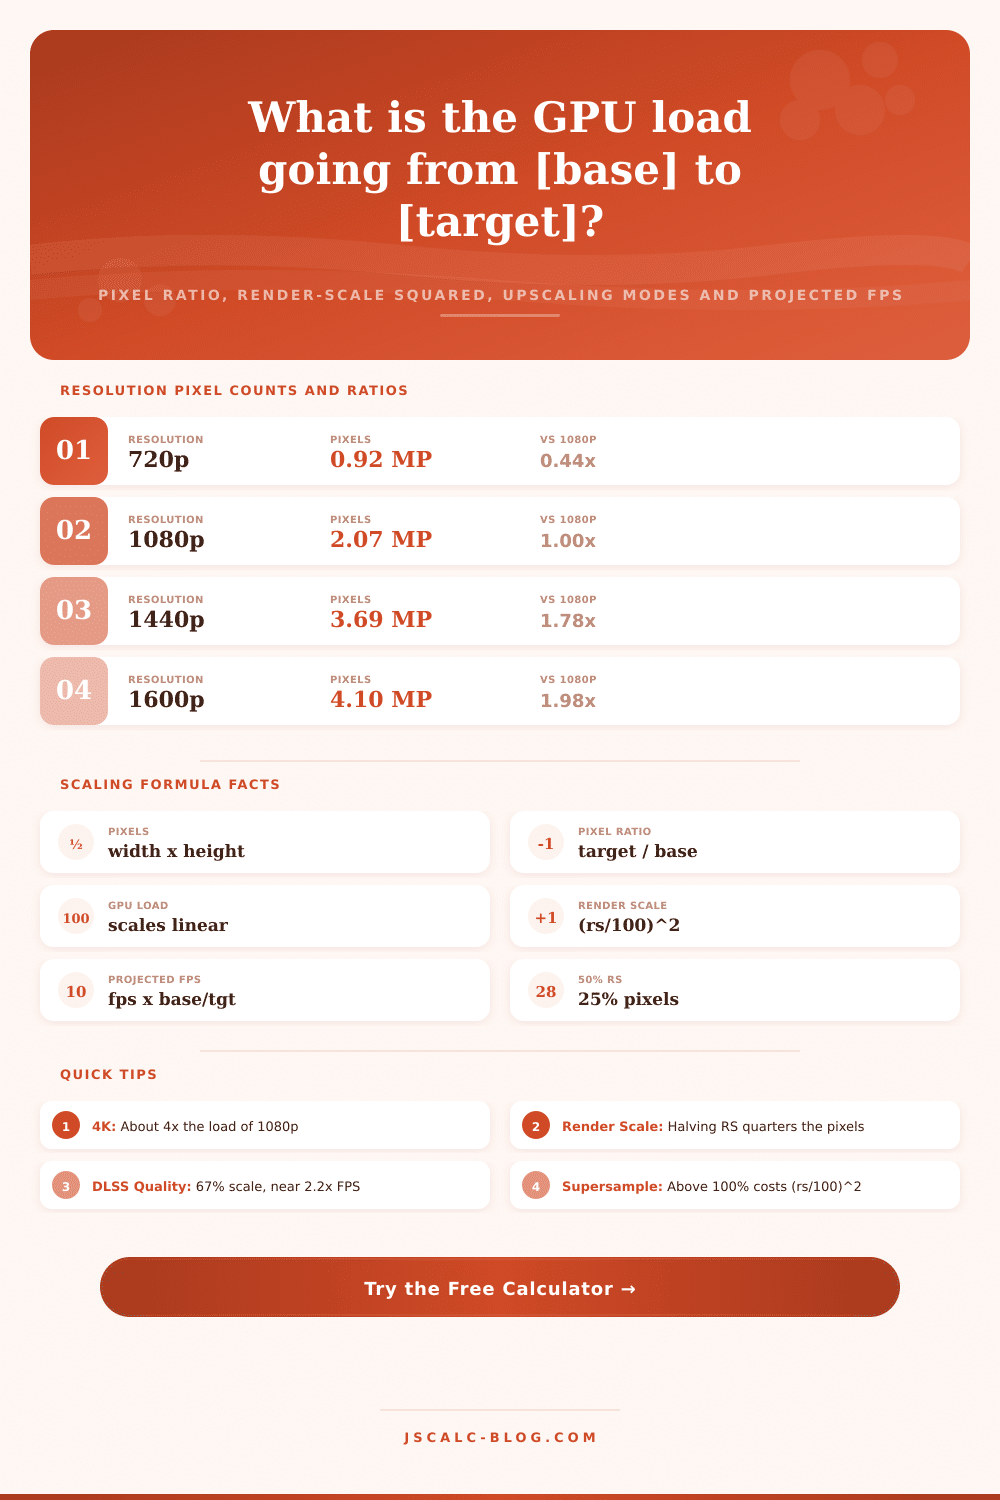
One frame is a grid composed of its width (horizontal) multiplied by its height (vertical). An average-sized 1080p frame consist of roughly two million pixels; 8 million pixels in a 4K frame. Dividing the big number by little number shows the difference: Four. In other words, 4K represents four times as much work per frame than 1080p.
That’s a straight-up calculation that will either stutter your game or keep it smooth. Use the calculator and you’ll quickly understand just what happens, no hand-calculation required. Knowing how those numbers play out can help you make smarter choices even when tool isn’t at your fingertips.
Many people also get confused by render scale, which doesn’t follow a linear relationship. If you’re playing a game like Overwatch or Fortnite and you set your render scale to fifty percent, it won’t render half as many pixels as normal. It’ll render half as wide AND half as tall. Since size scales by the square of its dimensions, that means it’s rendering only twenty-five percent of number of pixels. If you lower the scale down from one hundred to say, seventy-one, then you’ve cut the render load in half, since 0.71 squared is approximately equal to 0.5.
That means small changes around one hundred percent can return huge amounts of performance, since render scale follows a squared relationship. Many builders fall into this trap: they think there should be a linear response to changing settings, but that’s not how rendering work.
That’s the premise behind upscaling technologies such as FSR and DLSS, too: render at a lower resolution internally. This is called quality mode at a sixty-seven percent scale (approximately forty-five percent of your native pixels). That should of yield a roughly two point two times speedup since you’re doing half the work. If you want more performance, drop down to fifty percent scale (quarter the pixel count) for something between twice to three times the frames per second. And the calculator shows what your display will show versus what GPU actually draws in those internal resolutions.
If you know that less means exponentially fewer pixels, you don’t have to remember all the percentages. Rendering beyond your screen’s native resolution. Called supersampling. Eliminates aliasing, but at a cost to performance. One hundred forty-one percent roughly doubles the number of pixels being rendered; two-hundred-percent quadruples them. That added sharpness doesn’t come for free. And if your GPU is pushing as hard as it can go, reduction in framerate will be significant.
Knowing these multipliers in advance makes it easier to predict what your frame rate might be down the road. Are you running at 1080p and one-hundred-twenty frames per second? Native 4K will probably knock you down to thirty frames on account of that four-to-one ratio. This assumes you are GPU-bound, like most games running on maxed out settings these days.
For most common situations, the calculator also comes with helpful reference tables which let you look up load and megapixels directly. If you’re thinking about upgrading your system and want to know how much of a difference it will make, these tables can help. They go all the way up to 8K at several resolutions (from 720p) and include relative load and number of megapixels.
For example, seeing that 1440p is only seventy-eight percent more demanding than 1080p makes the cost of upgrading seem reasonable, considering the four-fold increase to 4K. Because pixel processing is such a fundamental bottleneck, these are good figures that hold true between generations and even on different cards.
Once you understand the math behind it, every subsequent resolution decision becomes a confident calculation instead of an experiment. You’ll always know exactly what you’re paying for in pixels.