RAM Latency in Nanoseconds Calculator
Turn a kit rating like DDR5-6000 CL30 into the number that actually matters: true first-word latency in nanoseconds. This tool converts data rate in MT/s and CAS Latency into ns, then reports memory clock, full random access time using tRCD and tRP, and effective bandwidth per channel.
⚡Popular Memory Kit Presets
🖥Memory Timing Inputs
Labels the kit and the reference notes only; the ns math is generation independent.
The transfers per second on the box, e.g. 3200, 3600, 6000, 6400.
The first number in a timing set like 16-18-18. Drives first-word latency.
RAS to CAS delay. Added for a full random (row miss) access.
Row precharge time. Also added for a row miss access.
Active to precharge time. Shown as a reference cycle window in ns.
Extra command clocks added on top of a full row-miss access.
Scales the effective bandwidth result. Latency in ns does not change.
A reference label for the timings you entered above.
Controls rounding on the nanosecond result cards.
🔢Formula Snapshot
📈First-Word Latency by Kit
| Kit | Data Rate | CAS CL | True Latency ns |
|---|---|---|---|
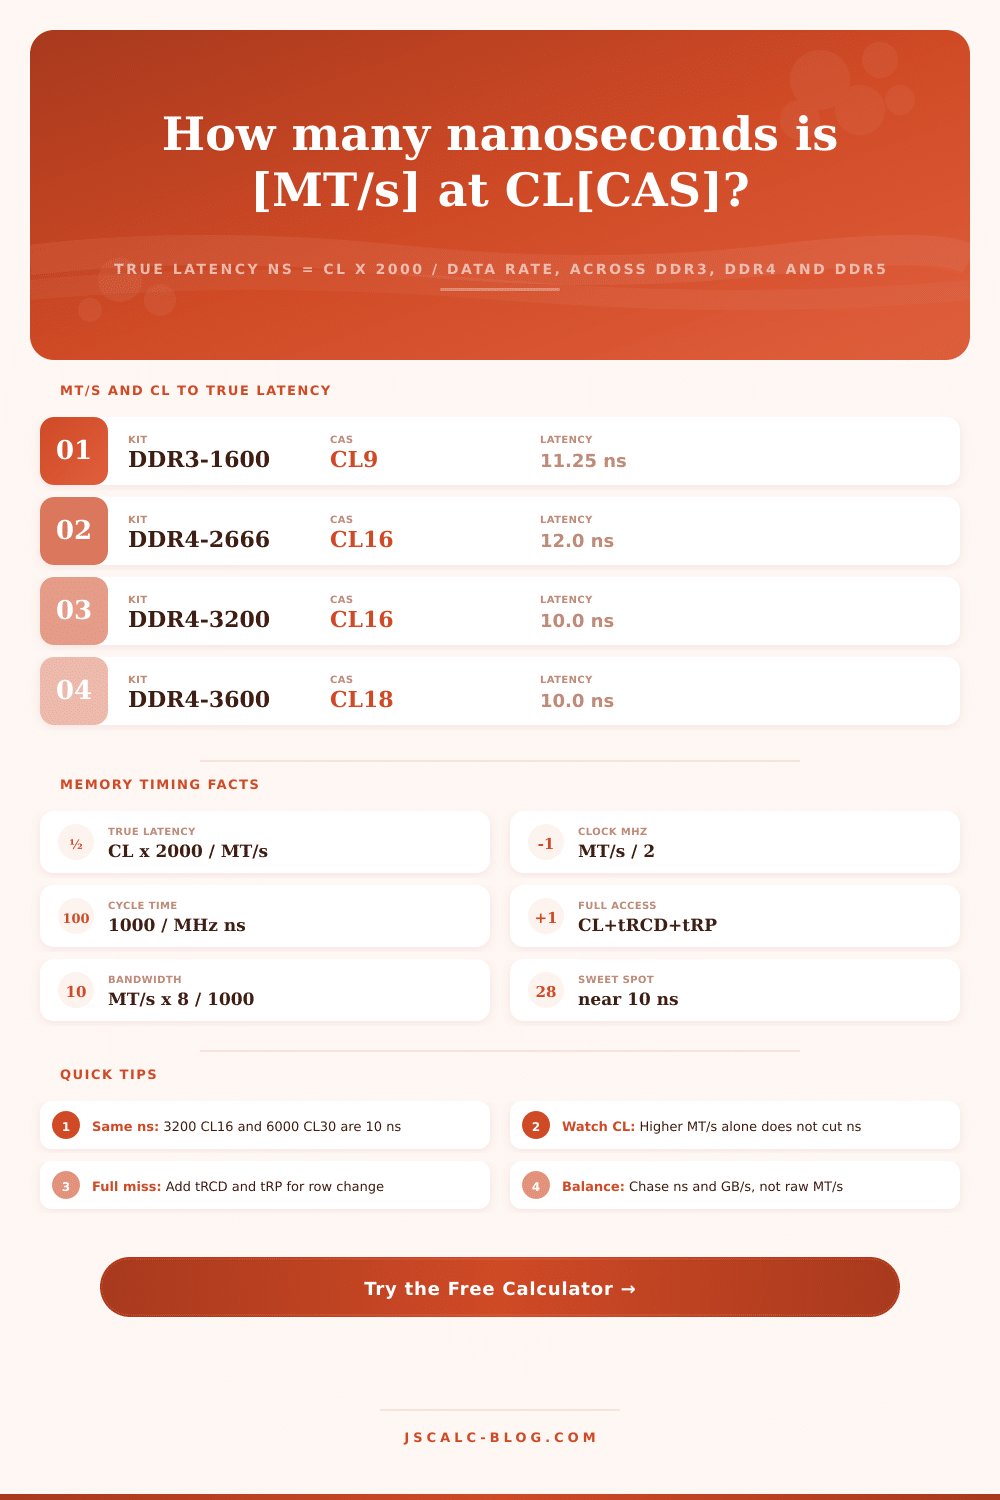
| DDR3-1600 | 1600 MT/s | CL9 | 11.25 ns |
| DDR3-1866 | 1866 MT/s | CL10 | 10.72 ns |
| DDR4-2666 | 2666 MT/s | CL16 | 12.00 ns |
| DDR4-3200 | 3200 MT/s | CL16 | 10.00 ns |
| DDR4-3600 | 3600 MT/s | CL18 | 10.00 ns |
| DDR4-4000 | 4000 MT/s | CL18 | 9.00 ns |
| DDR5-6000 | 6000 MT/s | CL30 | 10.00 ns |
| DDR5-6400 | 6400 MT/s | CL32 | 10.00 ns |
📊Same Nanoseconds, Different CL
| Kit A | Kit B | Both Latency | Why It Ties |
|---|---|---|---|
| DDR4-3200 CL16 | DDR5-6000 CL30 | 10.00 ns | Double MT/s, near double CL |
| DDR4-3600 CL18 | DDR5-7200 CL36 | 10.00 ns | Ratio CL / MT/s equal |
| DDR4-2400 CL15 | DDR5-4800 CL30 | 12.50 ns | Both scale the same way |
| DDR4-4000 CL20 | DDR5-8000 CL40 | 10.00 ns | Speed and CL both x2 |
| DDR3-1600 CL8 | DDR4-3200 CL16 | 10.00 ns | CL and MT/s both x2 |
| DDR5-6000 CL36 | DDR5-5000 CL30 | 12.00 ns | Lower speed, lower CL |
🗃DDR3 to DDR5 Comparison Grid
| Memory Kit | Data Rate MT/s | CAS CL | Clock MHz | True Latency ns | Bandwidth GB/s |
|---|---|---|---|---|---|
| DDR3-1333 CL9 | 1333 | 9 | 666.5 | 13.50 ns | 10.66 |
| DDR3-1600 CL9 | 1600 | 9 | 800.0 | 11.25 ns | 12.80 |
| DDR4-2666 CL16 | 2666 | 16 | 1333.0 | 12.00 ns | 21.33 |
| DDR4-3200 CL16 | 3200 | 16 | 1600.0 | 10.00 ns | 25.60 |
| DDR4-3600 CL18 | 3600 | 18 | 1800.0 | 10.00 ns | 28.80 |
| DDR5-4800 CL40 | 4800 | 40 | 2400.0 | 16.67 ns | 38.40 |
| DDR5-6000 CL30 | 6000 | 30 | 3000.0 | 10.00 ns | 48.00 |
| DDR5-6400 CL32 | 6400 | 32 | 3200.0 | 10.00 ns | 51.20 |
| DDR5-7200 CL34 | 7200 | 34 | 3600.0 | 9.44 ns | 57.60 |
| DDR5-8000 CL38 | 8000 | 38 | 4000.0 | 9.50 ns | 64.00 |
⏱Cycle Time Reference
| Data Rate | Clock MHz | Cycle Time ns | 10 ns Needs CL |
|---|---|---|---|
| 1600 MT/s | 800 MHz | 1.250 ns | CL8 |
| 2666 MT/s | 1333 MHz | 0.750 ns | CL13 |
| 3200 MT/s | 1600 MHz | 0.625 ns | CL16 |
| 3600 MT/s | 1800 MHz | 0.556 ns | CL18 |
| 6000 MT/s | 3000 MHz | 0.333 ns | CL30 |
| 6400 MT/s | 3200 MHz | 0.313 ns | CL32 |
⚙Formula Breakdown
💡Memory Tuning Tips
Memory marketing stuff loves big numbers. DDR5-8000 looks faster than DDR4-4000. And a 30-CL memory kit sounds like it’s slower then a 16-CL memory kit. But neither of those impressions will clue you in on how long the CPU has to wait for a read. You want to know its latency in nanoseconds, which is honest measurement. That’s why we have this RAM Latency in Nanoseconds Calculator. It’ll take those two numbers off any memory kits spec sheet and convert them into that real-time number.
There are only two: The data rate (in MT/s) and the CAS Latency (in cycles). It all makes sense when you finally see it in nanoseconds. CAS Latency isn’t measured in time; it’s measured in clock cycles. Until you understand how long a clock cycle is, there’s no point knowing how many of them has elapsed. The memory clock determines this; DDR memory do two transfers per clock. So the actual clock speed is only half the MT/s figure.
How to Compare RAM Speed and Latency
So a 3200 MT/s kit runs at 1600 MHz. A 6000 MT/s kit run at 3000 MHz. At higher speeds, a faster clock means shorter clock cycles. You’re buying fewer nanoseconds for the same CL count. So while a CL16 rating on a slower DDR4 kit might equate to a CL30 rating on a faster DDR5 kit, that doesn’t matter when comparing raw CL across generations. Until converted into nanoseconds, it’s meaningless.
Once you enter your CAS number and data rate into the calculator above, it will do the math for you. For first word latency, there’s one central equation, and it runs like this. There are 1000 nanoseconds per cycle. A cycle is defined by clock in megahertz (MHz). And CAS Latency is simply a number of cycles. If we substitute the clock with MT/s divided by two, then here is the neat trick: real latency is CL times 2000 divided by data rate in MT/s.
Let’s test this on the old standby. With DDR4-3200 CL16, that’s 16 times 2000 divided by 3200, which equates to an exact value of 10 nanoseconds. How about DDR5-6000 CL30? That’s 30 times 2000 divided by 6000 (again 10 nanoseconds). Two wildly different looking kits sitting side by side on the store shelf deliver exactly the same first word timing.
But that’s just a coincidence! That’s no coincidence at all. It turns out, the data rate/CL ratio doesn’t change with clock speed; it only changes if you simultaneously increase the CL and the MT/s. Double them both and you’ll still get the same ratio, meaning the nanoseconds won’t move.
That’s the single most valuable insight when shopping for memory. If a manufacturer increases the speed of the memory but simultaneously balloons the CAS Latency up as well, you’re paying for bandwidth, not for lower latency. Look at reference tables; they spell it out. DDR3, DDR4, and DDR5 memory kits can all line up directly next to each other on the 10 ns line, even though their CLs is anywhere from 8 to 40. Train yourself to notice such identical-latency twins at a glance.
The answer is: because bandwidth does matter, but only if latency is the same. And how do we know when that happens? It’s because each channel in a DDR4 or DDR5 memory device transfers 8 bytes every time it runs; it’s 64-bits wide (which is 8 bytes). Then, there are multiple channels. A single-channel DDR4-3200 provides a maximum of 25.6 GB/s. That’s 32 GB/s per channel, at the exact same 10 ns latency, for DDR5-6000. More throughput! For content creation, for integrated graphics, for large sequential workload.
That’s what the bandwidth number means in addition to the latency number. It’s reported for one channel, two channels, or even four channels. You don’t have to focus on just one dimension. You can weight them both together. CAS Latency describes the best case, when the row you want is already open. In reality, real accesses will land on a closed row. This forces the memory controller to wait for another tRP, the row precharge time. It must also wait for tRCD, the RAS to CAS delay, before it can even begin counting down to CAS.
This full random access card in the tool sums up all of these delays: CL + tRCD + tRP. Multiply this by the cycle time and add in your command rate, and you have the first word latency (10 ns) for a DDR4-3200 kit running 16-18-18 timings. Full row-miss access? More like 33 ns. So knowing both lets you keep expectations grounded; you can tighten those secondary timings, shrinking that worst case without changing CL.
Each run is summarized with four cards. First is the true first-word latency, which is the headline nanosecond figure from CL times 2000 divided by MT/s. Second is the memory clock card showing the actual MHz beneath the MT/s label. Third is the full random access card, which breaks down the row-miss time using CL plus tRCD plus tRP plus command clocks. Fourth is the effective bandwidth card, multiplying throughput per channel by number of channels. The breakdown panel for each substitution is printed beneath these cards, one line at a time.
So the calculator isn’t just a tool for overclock target checking prior to committing in the BIOS, it’s also a teaching aid. Instead of round numbers for toys, these are actual, widely available settings from their presets. Load up DDR3-1600 CL9 or DDR4-2666 CL16 or whatever common kit you want, and it loads those values, plus all the tRAS, tRCD, and tRP timings. Then it recalculates instantaneous.
Which means when you’re side-by-side shopping for memory, you can load a kit, read off the GB/s and the ns, load another, and compare. Or you could of loaded a preset, adjust one of them by one, say tighten the CL by 1, and see what the latencies do if you did that, tweaking manually. This is the same discipline whether you’re building a gaming rig, selecting a laptop kit or getting more responsiveness out of what you have.
First, convert all candidates to nanoseconds; if they match (or come close), use bandwidth as the tie-breaker. Often, you’ll find that a cheaper kit with matching ns and nearly-matching GB/s is the smarter purchase. In a second, this calculator will give you those figures. It translates confusing MT/s and CL labels into easy-to-understand time, and it reveals just how much the same 10 ns can hide under a dozen wildly different price tags. Enter your kit, read the cards, and watch the nanoseconds settle the argument.