CAS Latency Calculator
Convert CAS Latency (CL) and memory speed in MT/s into true first-word access time in nanoseconds using ns = CL x 2000 / MT/s, then pit two RAM kits against each other to see which one is genuinely faster and by how many nanoseconds and percent, because a lower CL number means nothing until you factor in the clock speed behind it.
🕑Choose a Mode
🎯Head-to-Head Kit Presets
📝Memory Kit Inputs
Labels the kits only; the ns math is the same across generations.
Controls rounding on every latency result.
Rated data rate, for example 6000 for DDR5-6000.
First number in the timing set, e.g. 30 in 30-38-38.
Data rate of the rival kit you are comparing.
CAS Latency of the rival kit, its first timing number.
A speed you plan to tune Kit A to, at the same CL.
🔢Formula Snapshot
📊Kit Comparison Grid
| Kit | Speed MT/s | CAS CL | Cycle tCK | Latency ns | Relative Rank |
|---|---|---|---|---|---|
| DDR4-3200 C14 | 3200 | 14 | 0.625 ns | 8.75 ns | Fast |
| DDR4-3600 C16 | 3600 | 16 | 0.556 ns | 8.89 ns | Fast |
| DDR5-7200 C34 | 7200 | 34 | 0.278 ns | 9.44 ns | Quick |
| DDR5-8000 C38 | 8000 | 38 | 0.250 ns | 9.50 ns | Quick |
| DDR4-3200 C16 | 3200 | 16 | 0.625 ns | 10.00 ns | Baseline |
| DDR5-6000 C30 | 6000 | 30 | 0.333 ns | 10.00 ns | Baseline |
| DDR5-6400 C32 | 6400 | 32 | 0.313 ns | 10.00 ns | Baseline |
| DDR4-3600 C18 | 3600 | 18 | 0.556 ns | 10.00 ns | Baseline |
| DDR5-5600 C36 | 5600 | 36 | 0.357 ns | 12.86 ns | Slow |
| DDR5-4800 C40 | 4800 | 40 | 0.417 ns | 16.67 ns | Slow |
🧩Same-Speed CL Ladder
| Speed MT/s | CL Value | Latency ns | vs Its CL16 or CL30 |
|---|---|---|---|
| 3600 | CL14 | 7.78 ns | Faster |
| 3600 | CL16 | 8.89 ns | Reference |
| 3600 | CL18 | 10.00 ns | Slower |
| 6000 | CL28 | 9.33 ns | Faster |
| 6000 | CL30 | 10.00 ns | Reference |
| 6000 | CL36 | 12.00 ns | Slower |
| 6400 | CL30 | 9.38 ns | Faster |
| 6400 | CL32 | 10.00 ns | Reference |
🔗Speed to Clock and Cycle Time
| Data Rate MT/s | Real Clock MHz | Cycle tCK ns | Common Label |
|---|---|---|---|
| 3200 | 1600 MHz | 0.625 ns | DDR4-3200 |
| 3600 | 1800 MHz | 0.556 ns | DDR4-3600 |
| 4800 | 2400 MHz | 0.417 ns | DDR5-4800 |
| 5600 | 2800 MHz | 0.357 ns | DDR5-5600 |
| 6000 | 3000 MHz | 0.333 ns | DDR5-6000 |
| 6400 | 3200 MHz | 0.313 ns | DDR5-6400 |
| 8000 | 4000 MHz | 0.250 ns | DDR5-8000 |
⚙Formula Breakdown
💡CAS Latency Buying Tips
The spec sheet lies by omission “DDR5-6000 CL30 vs DDR4-3200 CL16, which one is better?” And then it shows those labels, and you’re confused. Low latency looks good on paper, and higher speeds sound great by themselves. What they won’t tell you is how they work together in practice, because manufacturers don’t care about that. That’s where our calculator does all of the math for you. So you don’t need to figure out fractions staring down an online shopping cart. It also converts all of those cycle counts into something real: nanoseconds. Because if CPU is waiting on memory, nanoseconds are the only measurement that matters.
The CAS refers to Column Address Strobe. This means it’s requesting certain columns of data from a currently open row of the memory, and the latency number indicate how long that takes in terms of clock cycles. So yeah sixteen sounds nicer than thirty, but it depends on what your clock speed is. Clock speed dictates how long each tick lasts. If you have a higher frequency then your clock speed runs quicker, so each individual cycle will be shorter. It’s possible a system running with a higher CL number and much higher frequency can still have less total wait time compared to another system with lower CL number and slower frequency. That’s where a lot of folks gets confused when upgrading their systems.
What RAM Speed Is Better?
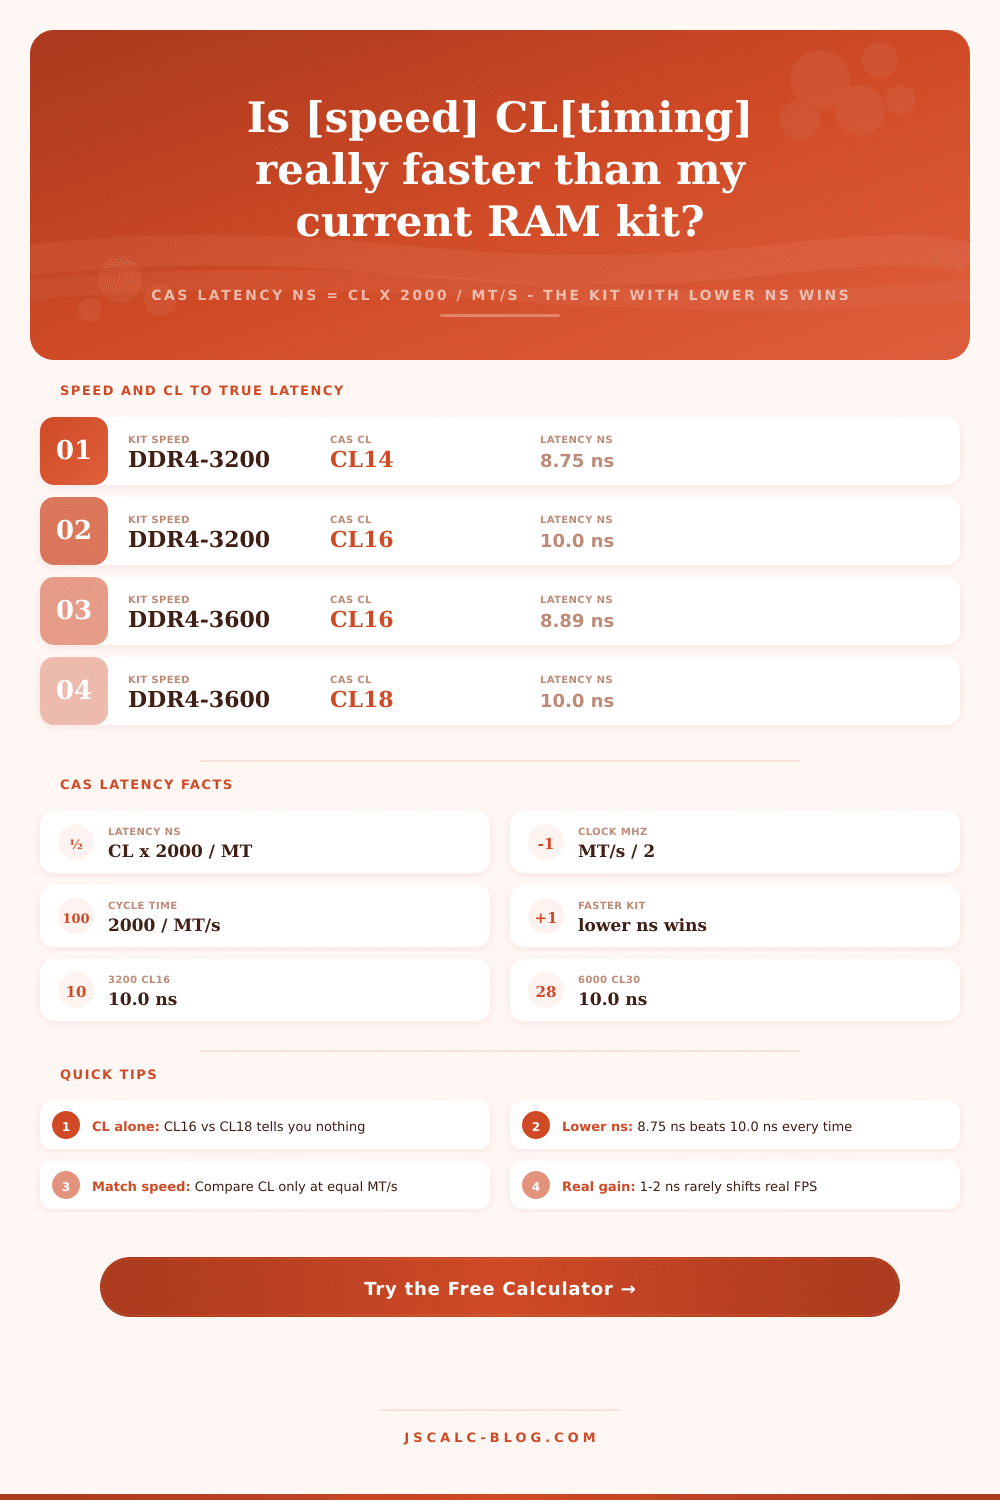
Once you understand how this works, the formula is straightforward. Multiply the CAS Latency by 2000, then divide that value by the memory speed (in MT/s). Why the 2000? Because DDR only moves data on the rising edge of the clock signal (plus it sends it again on the falling edge), so actual clock rate is half what’s advertised as the data transfer rate. So at 6000 MT/s, a single cycle is about one-third of a nanosecond. It’s double that at 3200 MT/s. Multiply each of these tiny values by the number of cycles needed to complete an access, and there’s your actual delay. In the case of DDR5-6000 CL30, result is 10.00 nanoseconds, a nice round number that eliminates all marketing hooey.
For example, compare DDR4-3200 CL16 and DDR4-3600 CL18. Sixteen is smaller than eighteen, right? So on paper, CL16 wins, but in real life they are equal at 10.00 nanoseconds. Why does the faster 3600 kit has higher latency? Because it’s running so fast that every single tick take less time to do. You can see that immediately if you put speeds into our calculator. The calculator will tell you that you’re wasting your time trying to chase lower CL numbers if speed remains constant. This almost never happens, as new kits typically come with higher speeds and a little bit more relaxed timings.
For competitive gamers who use high refresh rates and low resolutions, every millisecond of frame time matter. Getting that 1% low frame up to 9.38 ns instead of 10.00 ns could make your mouse feel smoother in fast paced shooters. For video editing or office work? You’ll never see a difference. Before CAS latency becomes a limiter, the bottleneck move into CPU architecture and bandwidth. Knowing this informs when you should of spend more on tighter timings and when you can cut corners with standard kits. You can also run overclock simulations with it which is a good way to plan out a build. For example, what happens when you OC a 6000 MT/s kit to 6400 but keep it running at CL30? Latency goes down to 9.38 ns. That’s still using the same amount of cycles, so you have less wait time plus more speed. That is a good thing if your mobo will allow it. The reference table on the page shows how slight increases in speed affect the latency equation.
In conclusion, when it comes to RAM shopping, never let someone sell you on a marketing slogan. Instead, compare similar products. The metric that matters here are nanoseconds, which also applies in both cases. In other words, don’t pay attention to the headline numbers; instead, consider how long it takes for your data to arrive. If you’re building out a gaming rig or a workstation, we do the math for you so you won’t have to guess and buy with confidence. But here’s the thing, faster isn’t always better. It might cost twice as much and only gain you a percent. Now you’ll know exactly what a percentage translates into before you hit the button to buy.